ggplot2
Data visualisation book showing the end-to-end process of building charts, starting from data acquisition to custom styling.
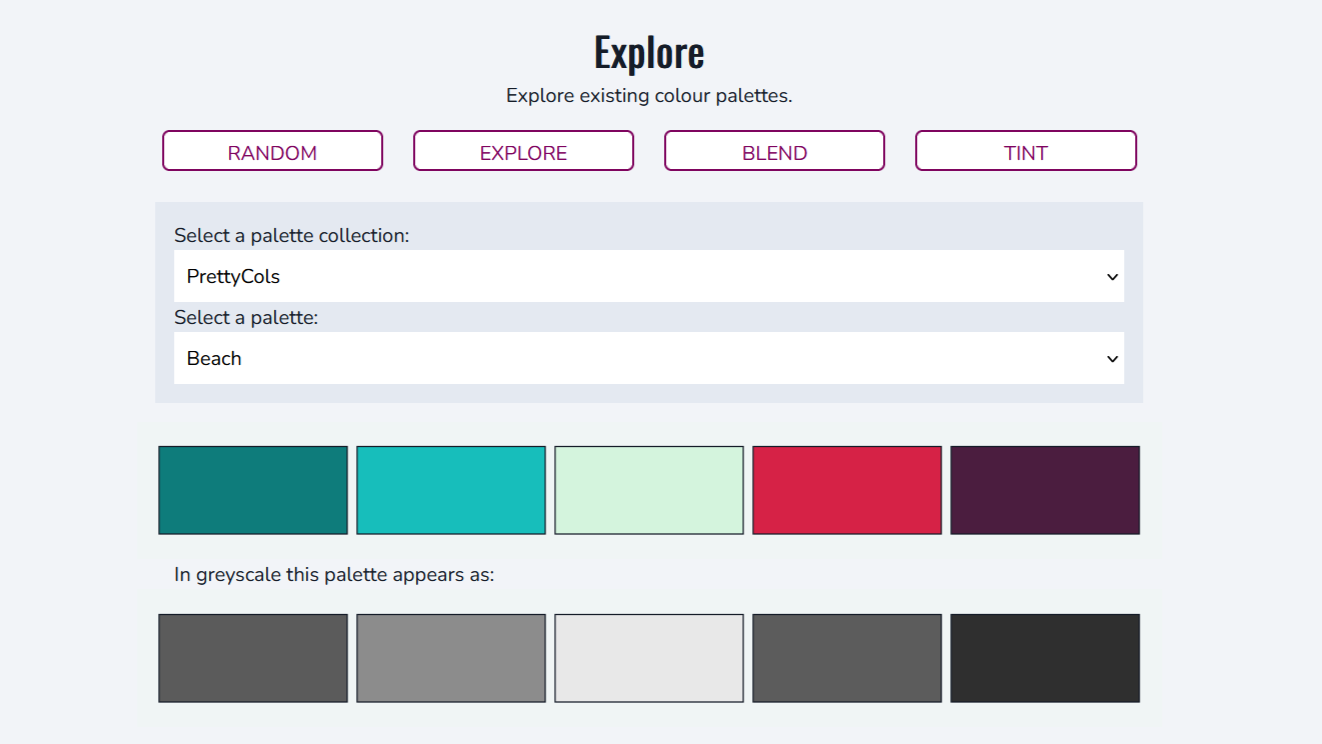
A collection of apps to create, explore, and adjust colours palettes for data visualisation, generative art, and design.
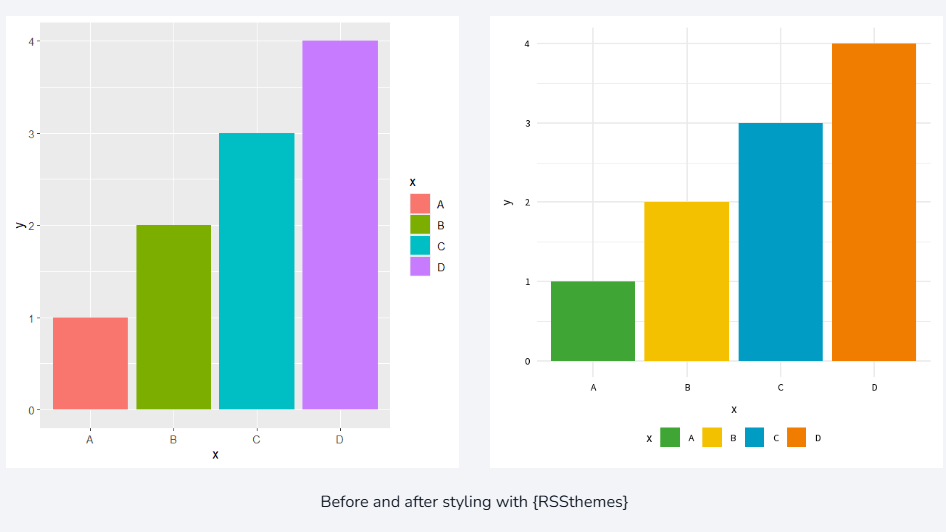
Data visualisation guidance produced for the Royal Statistical Society.
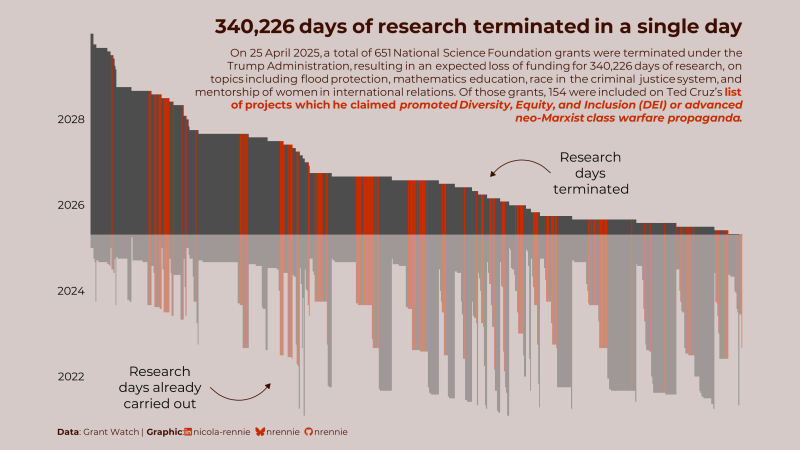
Examples of work created for different data visualisation challenges using R, Python, ObservableJS, D3.js, and other tools.
Published and submitted academic publications, and links to further blog posts.
Training courses, interactive workshops, and outreach work, covering programming, statistics, and visualisation.
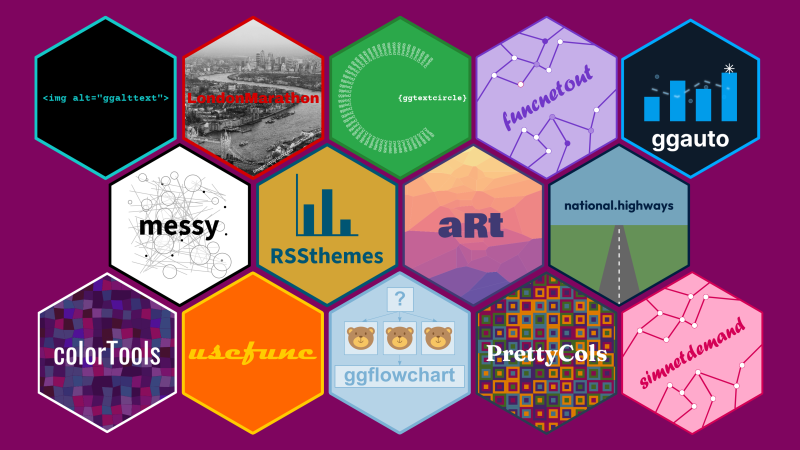
R packages for data visualisation, data generation, accessing data from APIs, and implementing statistical methodology.
I regularly work with local schools to encourage pupils to explore careers in statistics and data science, and understand how it’s used in the real world.
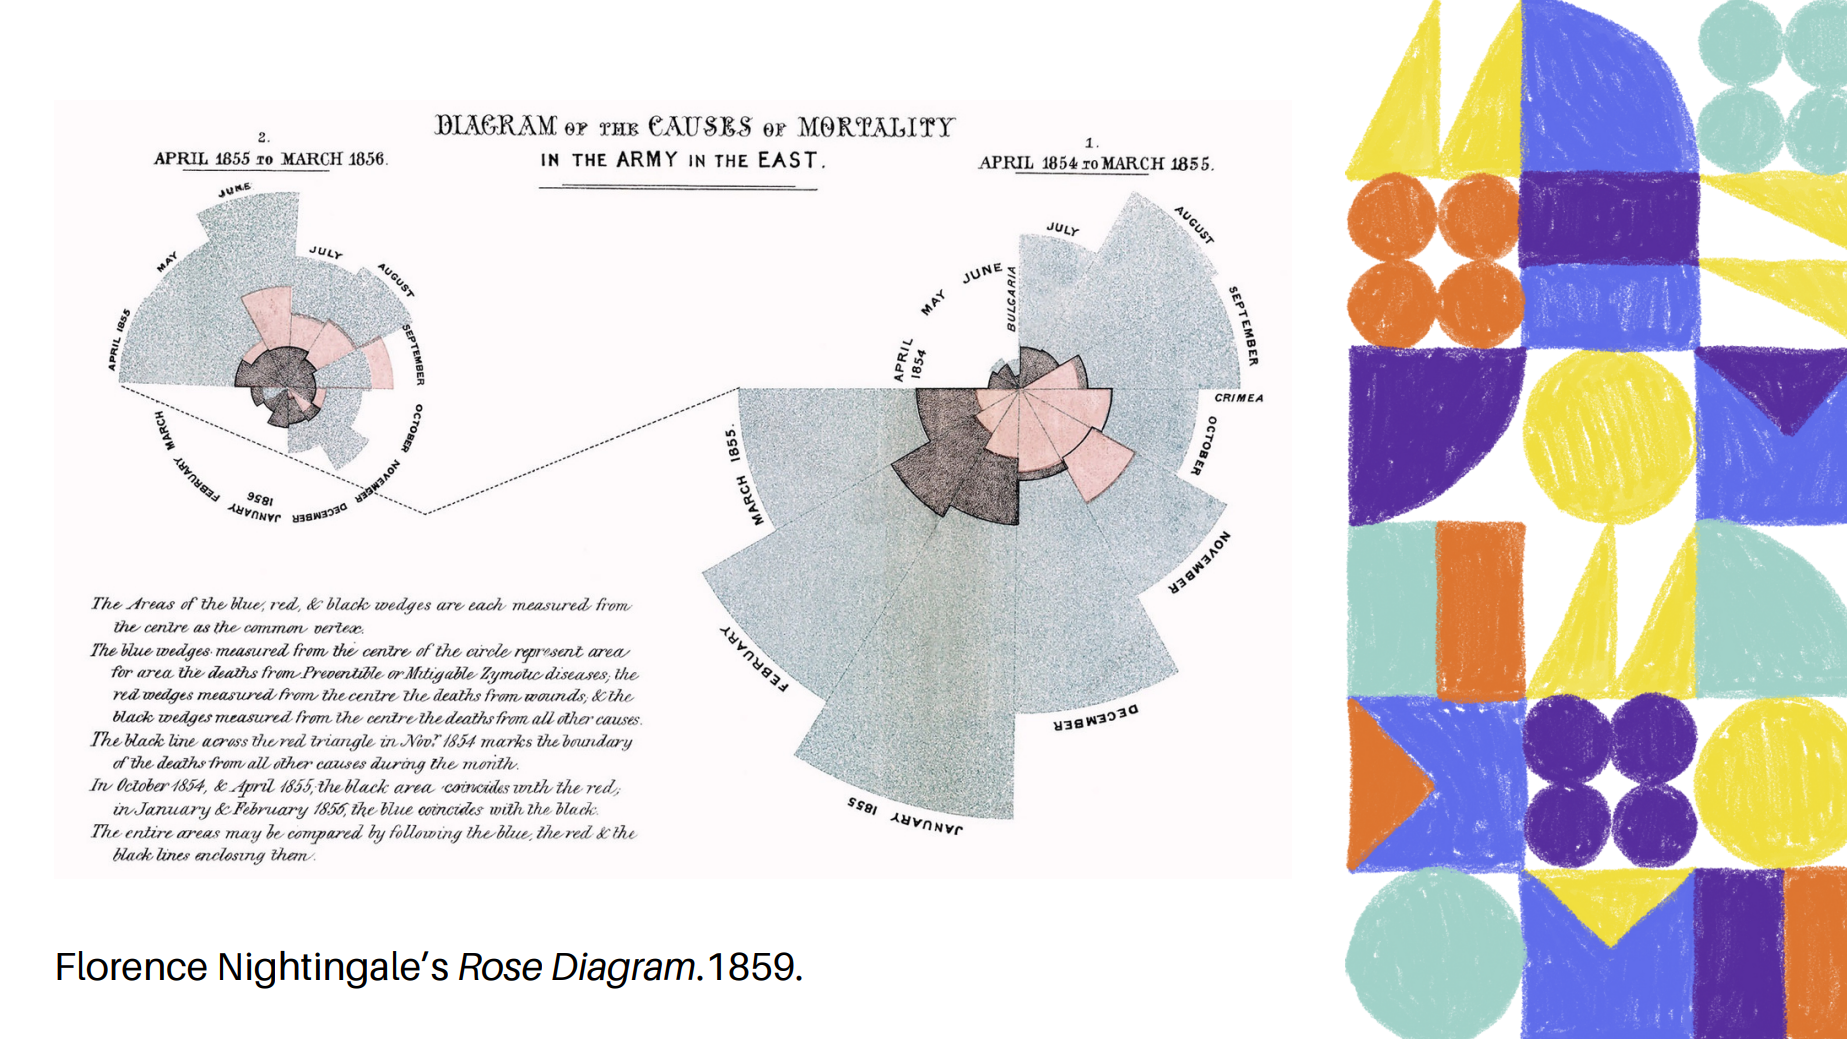
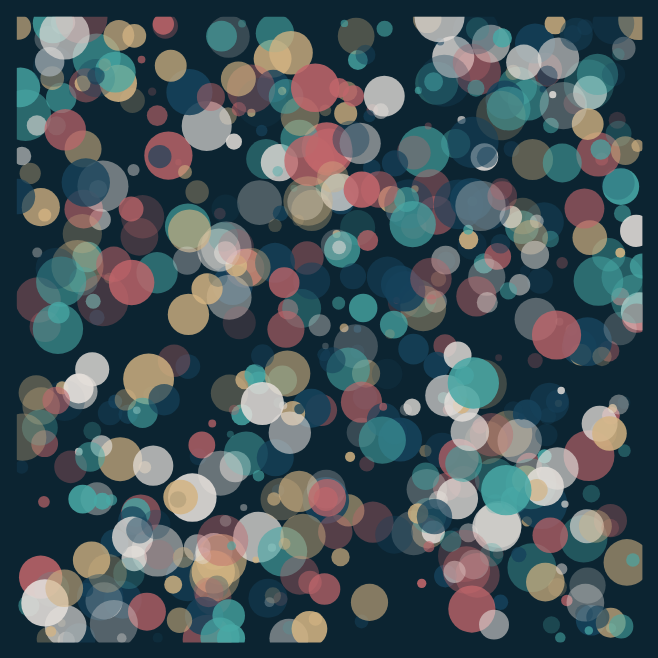
Generative art is a form of art that is created using algorithms, rules, or systems that are often (but not always) executed by computers.
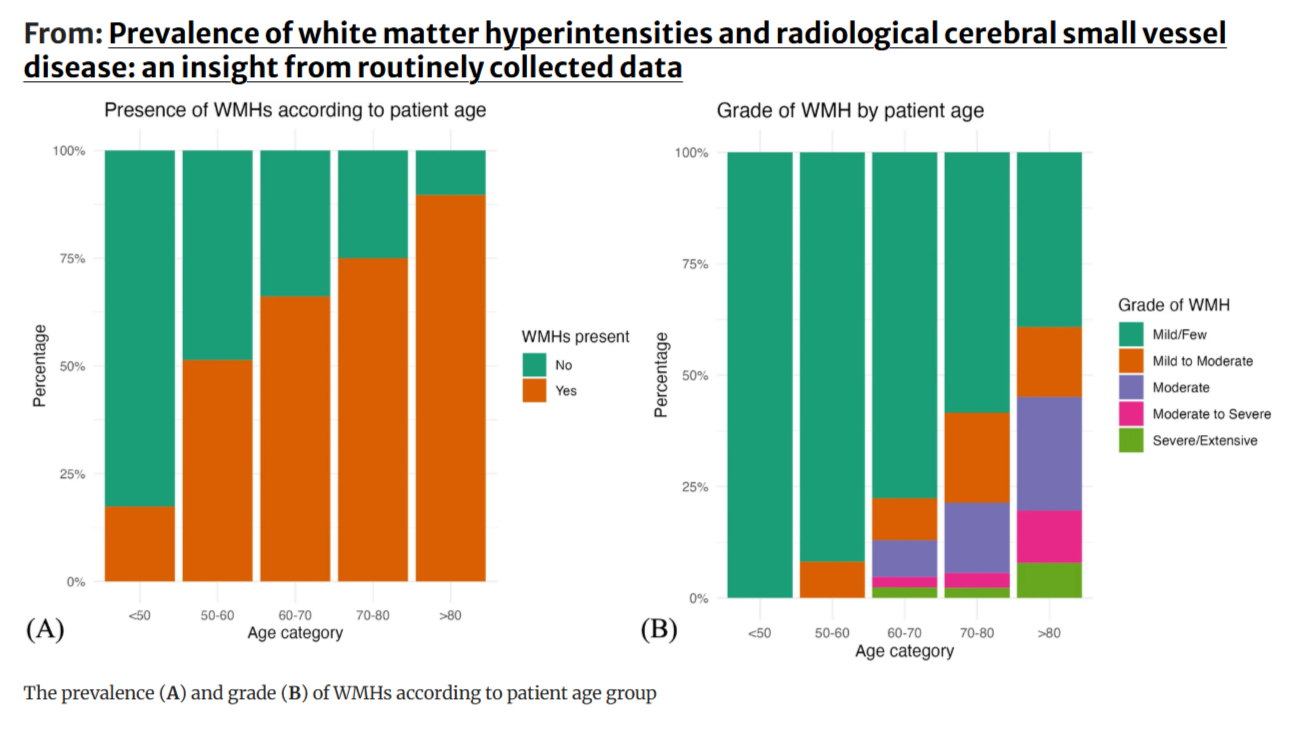
Different projects with applications in healthcare and medicine including neurology, reproductive healthcare, and the NHS workforce.
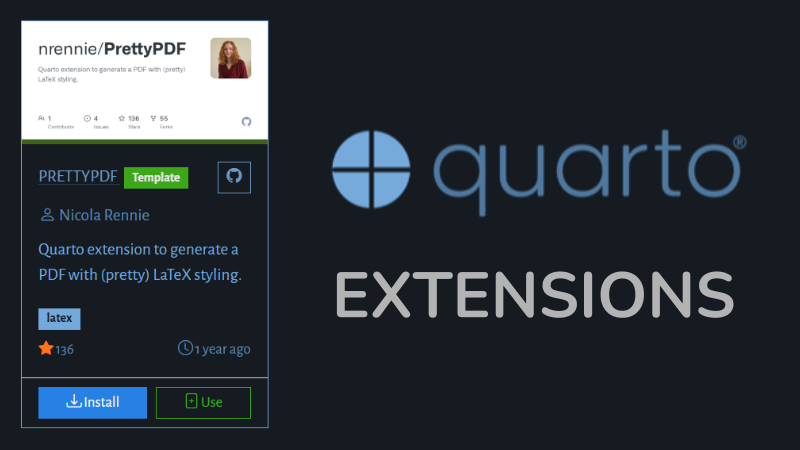
Quarto extensions are add-ons that enhance Quarto’s functionality by providing custom formats, filters, shortcodes, or tools for authoring and publishing documents.
Python packages for use in data visualisation and generative art.
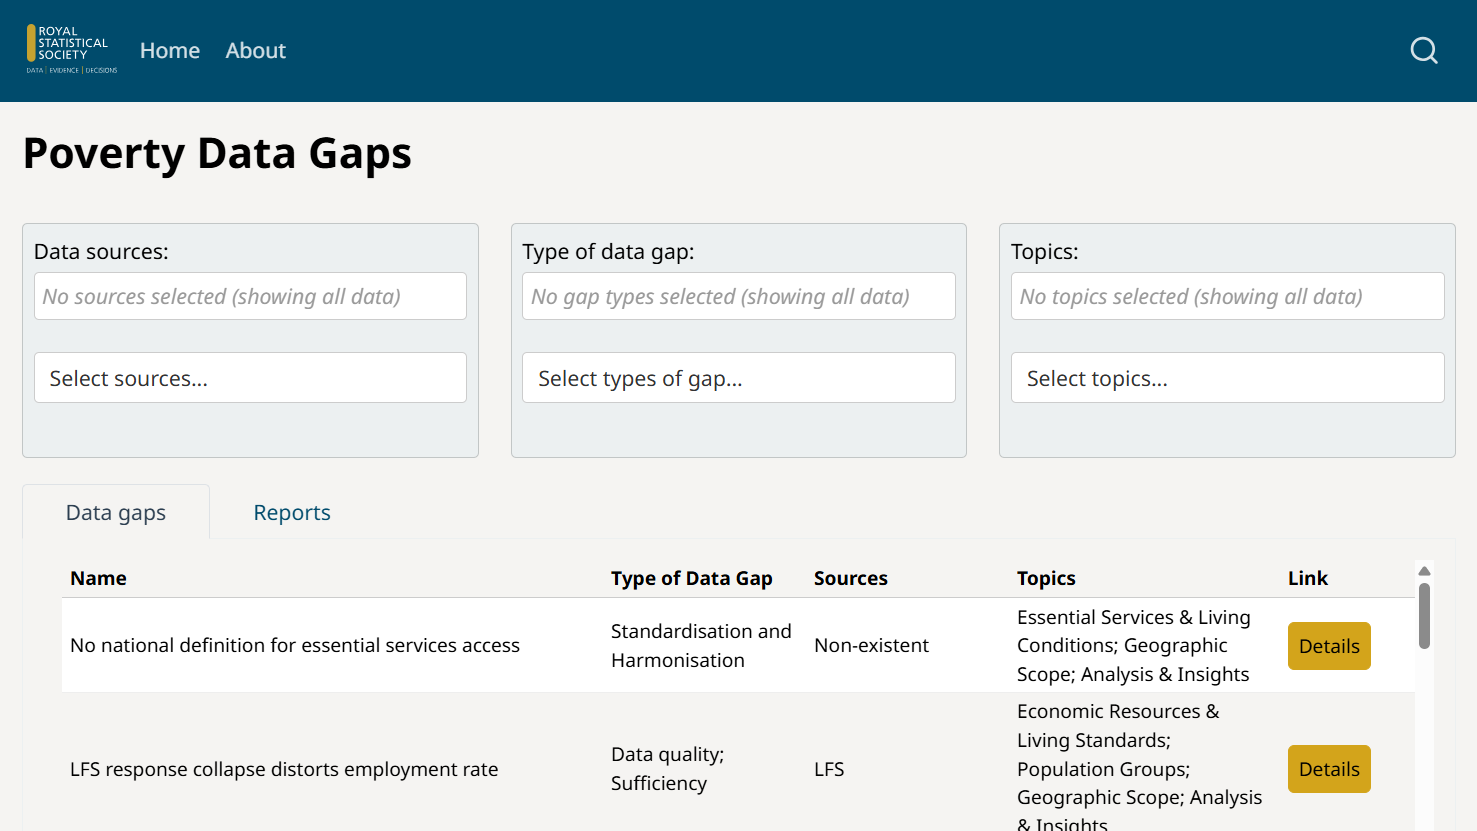
Interactive data explorer built with Quarto and Observable for the Royal Statistical Society and the Centre for Public Data.
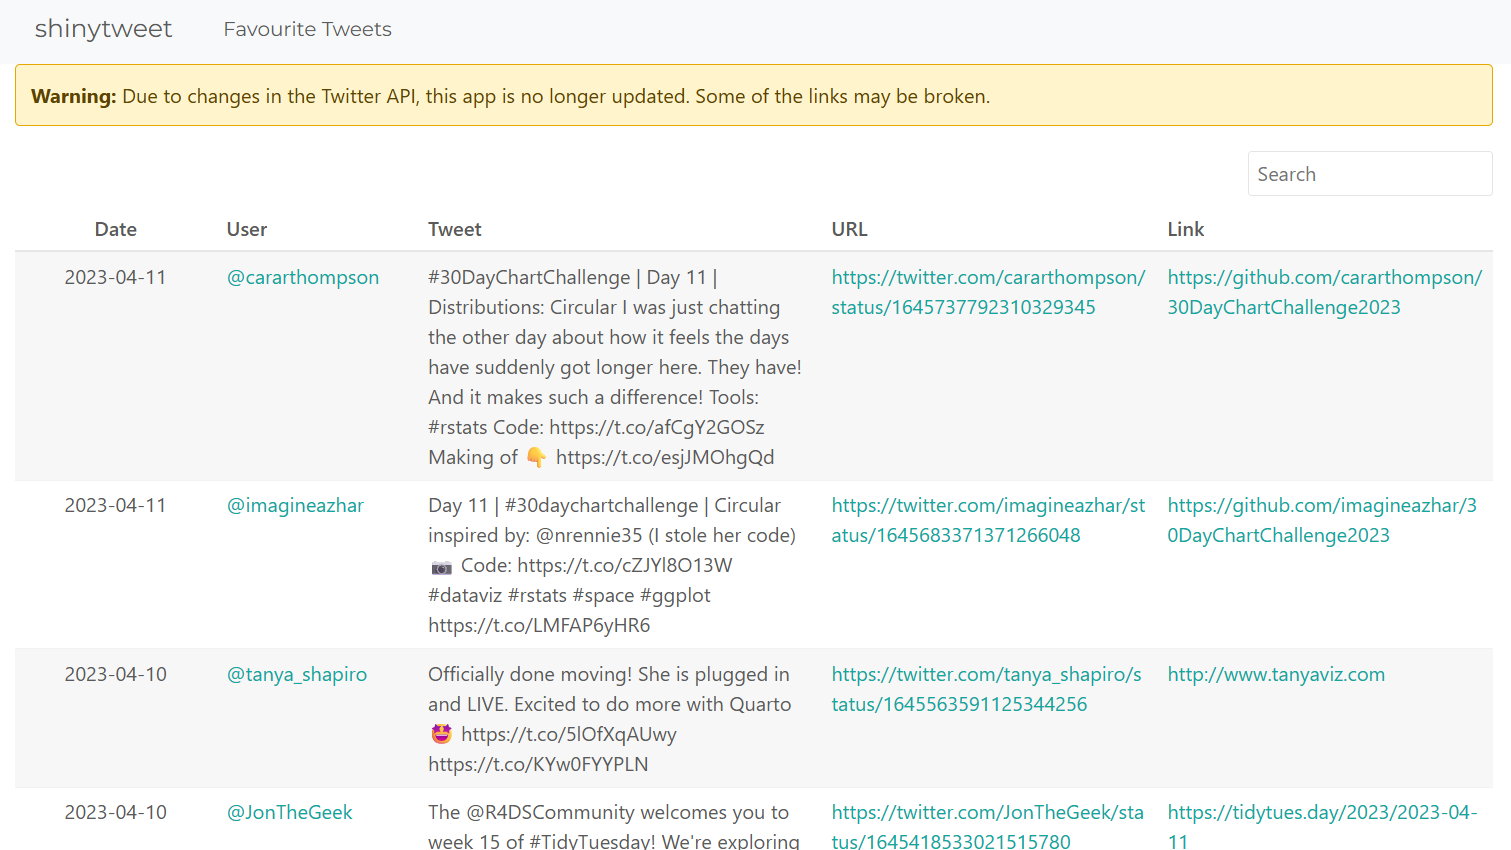
shinytweet
Browse links from tweets related to R, Python, and data science.
Developing tools and techniques to improve the teaching of statistics, particularly statistical programming.
Developing statistical methodology to identify outliers in transport demand, with applications to railway and bike-sharing networks.