shinytweet
shinytweet: Browse links from tweets related to R, Python, and data science
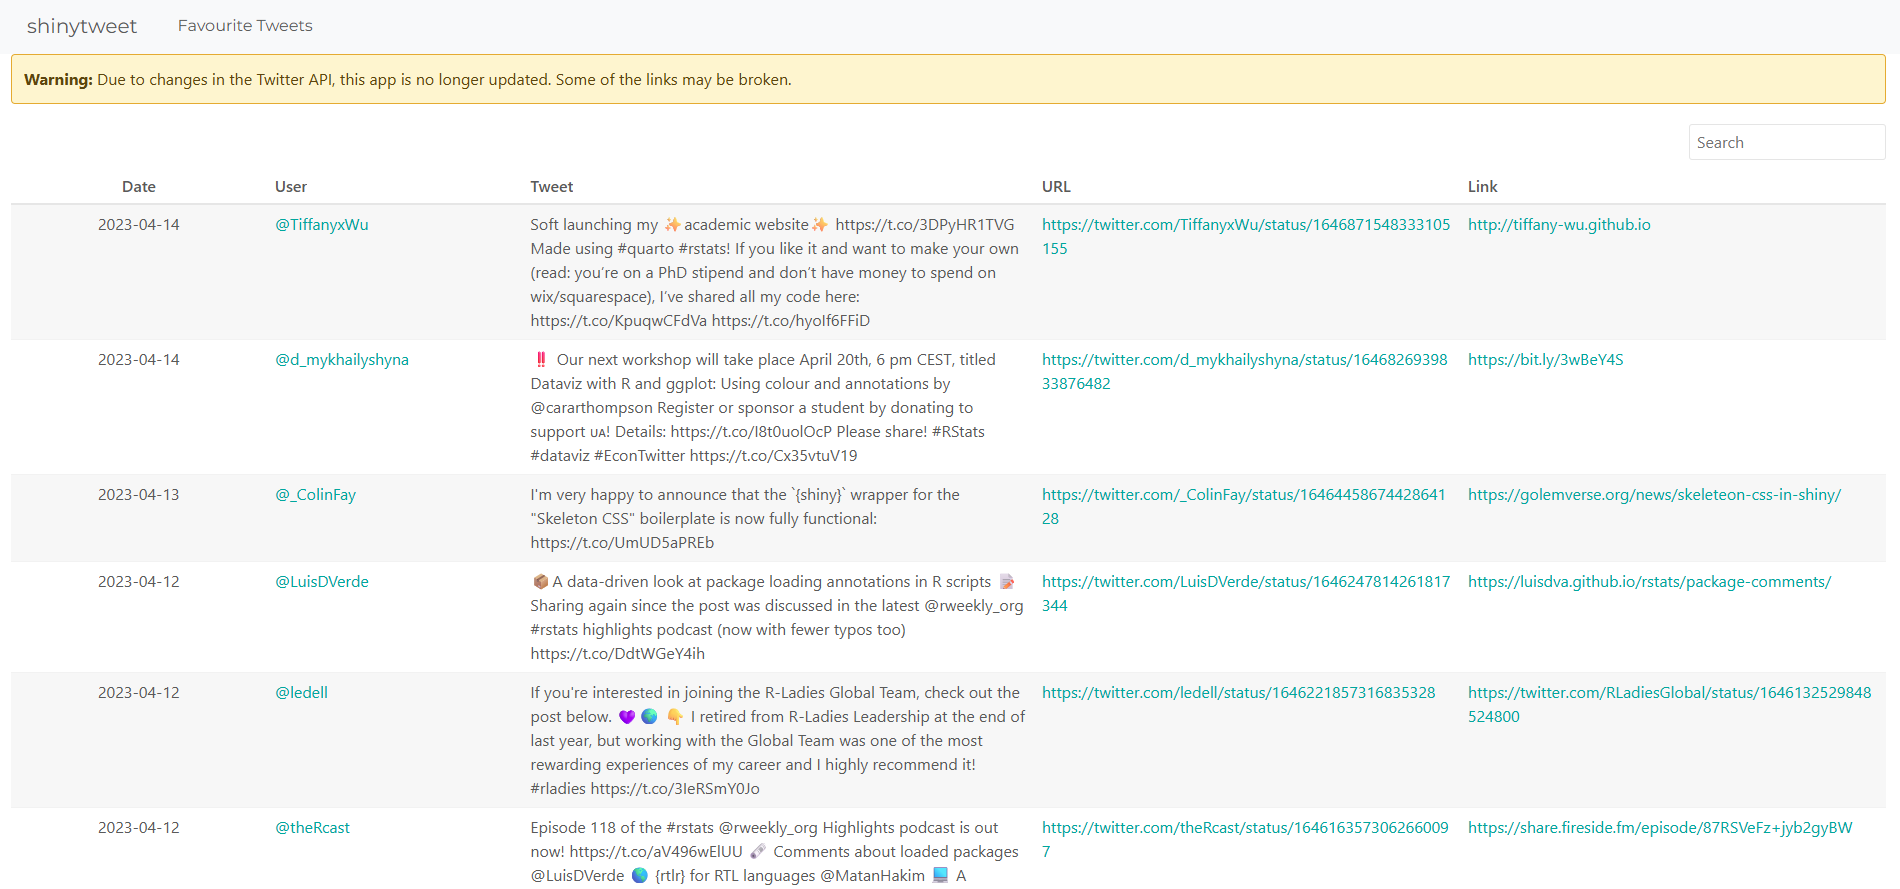
An R shiny application to browse liked tweets related to R, Python, and data science. This app used GitHub Actions to automatically update data and redeploy the shiny app.
Due to changes in the Twitter API, this app is no longer updated. Some of the links may be broken. Data is available up to April 2023.
Motivation and requirements
When browsing through social media, especially when endlessly scrolling on mobile, we regularly see interesting links about things related to data science. However, those links are either impossible to find again later on desktop or mixed in with lots of non-data science posts if using Twitter’s bookmark feature. We wanted a way to gather together all of the relevant links to interesting data science things without having to do any manual work.
Features
The dashboard has several features that make it more user friendly and easier to maintain:
- It pre-filters posts based on a set of keywords to ensure posts are relevant to R, Python, and data science.
- The data updates automatically on a schedule, meaning that there is no manual process involved in maintaining the dashboard’s relevance. It can also be triggered manually if required.
- The table is searchable meaning that a user can look for links posted about a specific topic, or by a specific user, or even from a specific website.
- It extracts and displays both the link to the original tweet and the link to the resource, meaning users can browser resources without visiting twitter but also see who and when it was posted.
Tools
The dashboard is built using freely available, open source tools.
- Data: the data is extracted through the Twitter API via R; with further processing in R. GitHub Actions is used to automatically run the extraction and processing scripts on a weekly basis.
- Dashboard: the dashboard is built using Shiny in R and makes use of the reactable package.
- Deployment: the dashboard is deployed through shinyapps.io, using GitHub Actions to automatically re-deploy the dashboard whenever the data or content changes. Docker is used to ensure the versions of R and any packages used are consistent, and package updates do not trigger failed deployments.
Read my blog post about creating, deploying, and updating this Shiny app for more information.
The deployment was changed to use Shinylive for R, which enables the dashboard to run in a user’s browser without relying on an external server like shinyapps.io. This means there are no restrictions on the number of users or the number of hours the dashboard is active per month, with no associated costs.
The dashboard can be viewed at nrennie.rbind.io/shinytweet.