Dashboards
I have developed several dashboards and applications, covering a variety of topics and uses, and a few are highlighted here:
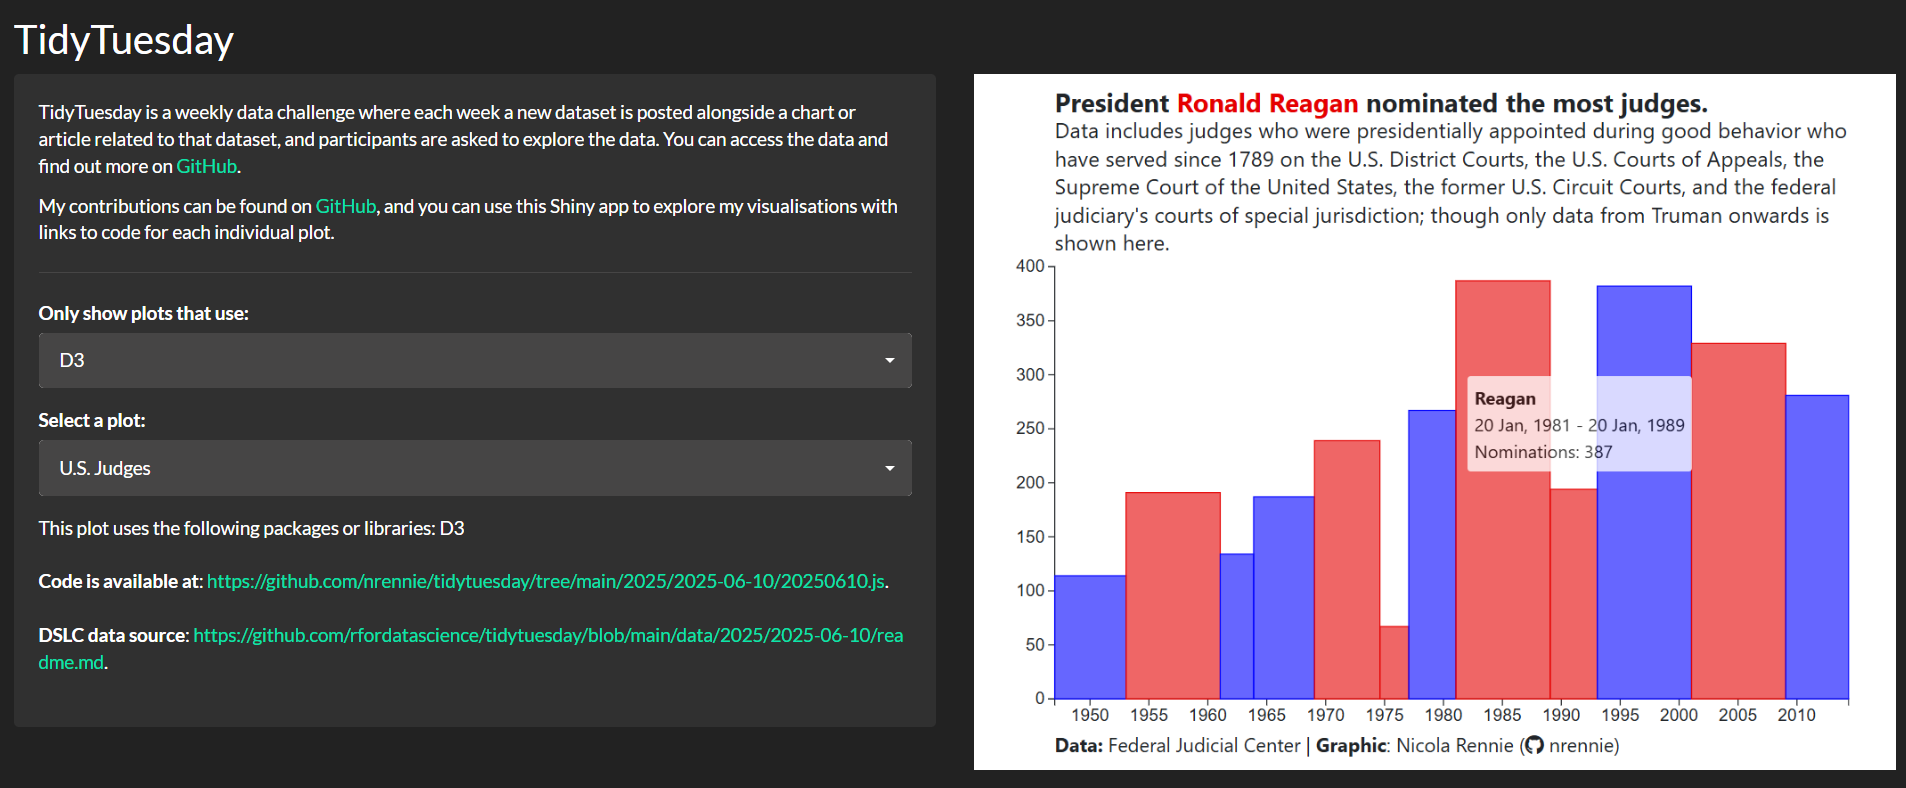
TidyTuesday: a self-updating visualisation explorer
An app that displays every TidyTuesday plot I’ve created, with functionality to search by packages used in creating the plots and links to the original code and data, that updates by itself whenever I create a new plot. This app is deployed using Shinylive for R, meaning it runs in the user’s web browser and does not require an R server. Read my blog post describing the process of building and deploying this Shiny app.
Tools: R, Shiny, GitHub Actions
Deployment: shinylive and GitHub Pages
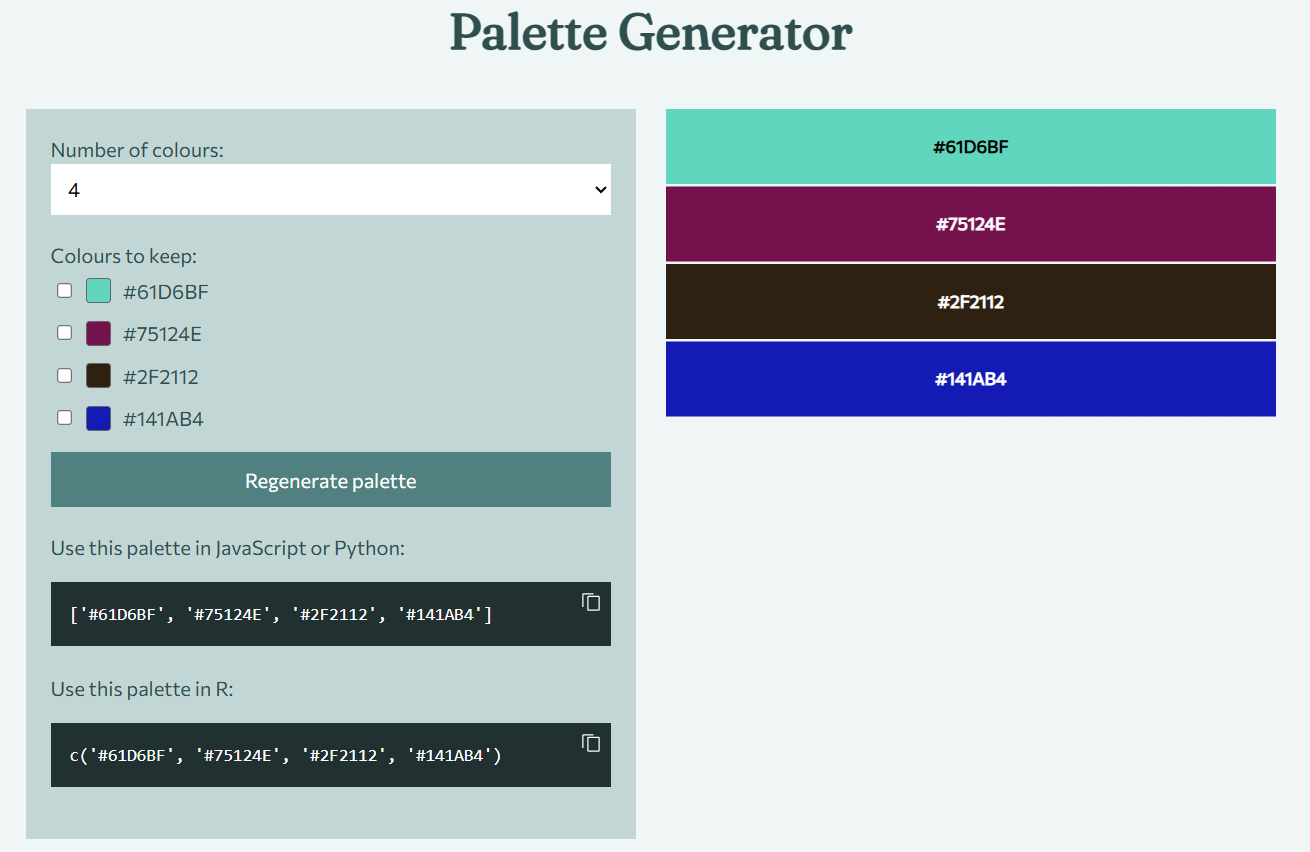
Palette Generator: create random colour palettes
An app that generates random colour palettes with up to 12 colours, with users able to choose which colours remain in the next palette generation. Code to use the palettes in R and Python is generated alongside the palettes.
Tools: JavaScript (D3.js)
Deployment: GitHub Pages
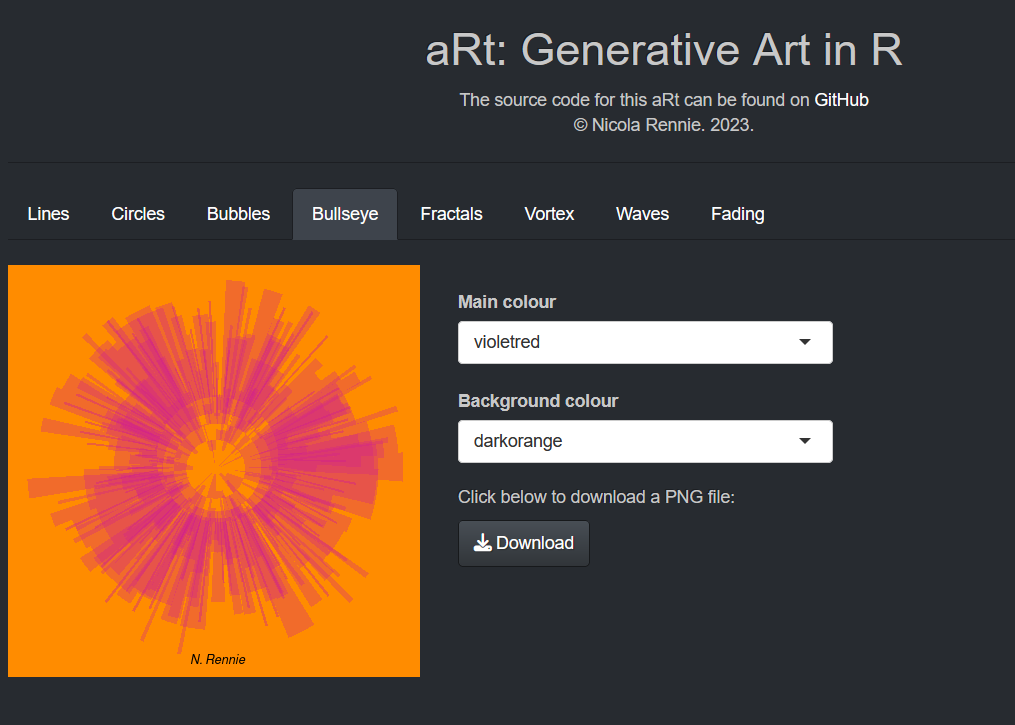
aRt: generate your own aRt
An application to generate and download generative art created in R. The app allows people to choose a piece of generative art, set colours and other parameters, then click a button to download a PNG file of the art.
Tools: R, Shiny
Deployment: shinyapps.io
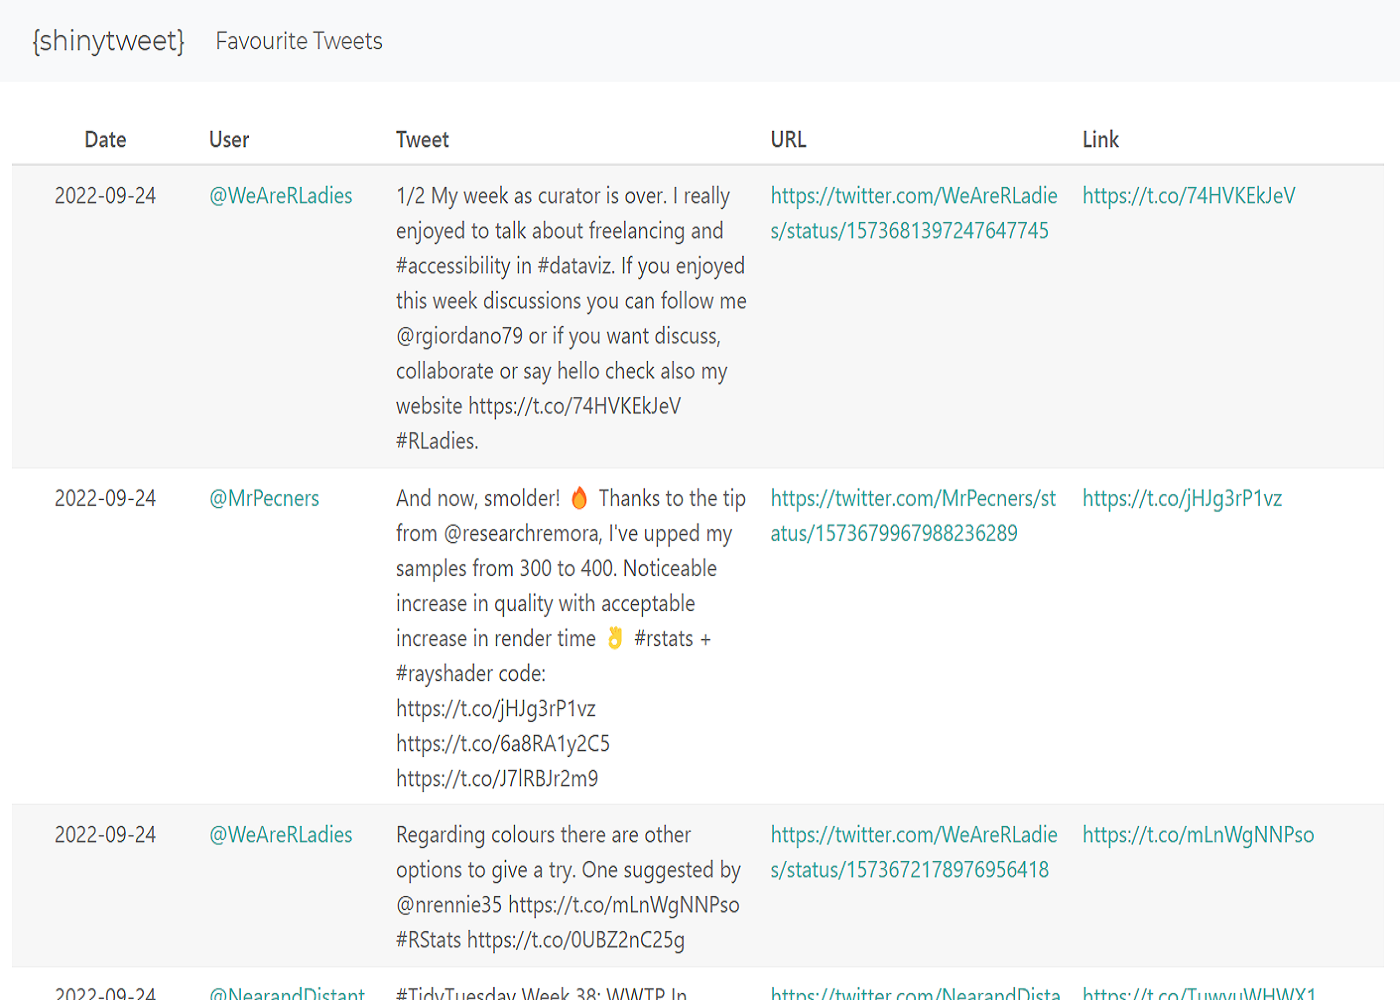
shinytweet: browse tweets related to R, Python, and data science
A simple R shiny application to browse liked tweets related to R, Python, and data science. This app used GitHub Actions to automatically update data and redeploy the shiny app. Read my blog post about creating, deploying, and updating this Shiny app for more information.
Tools: R, Shiny, GitHub Actions
Deployment: shinyapps.io
This app is no longer maintained due to changes with Twitter.