Developing your data visualisation skills in ggplot2
Data Visualisation
R
We’ll be working through the process of developing a visualisation in
ggplot2. Some knowledge of the tidyverse will be helpful, but all of the code in this session will be explained and available afterwards.
Abstract
In this session, we’ll be working through the process of developing a visualisation in ggplot2. We’ll start with a brand new dataset and create some exploratory plots; sketch out some ideas and decide what we want to communicate; build a basic plot in ggplot2; and then refine our chart to create something that’s artistic and aesthetic, yet effective. Some basic knowledge of the tidyverse will be helpful, but all of the code in this session will be explained and made available afterwards.
Code
The code from the live demonstrations can be found below. This may differ slightly from the examples in the slides.
# Load packages
library(dplyr)
library(tidyr)
library(ggplot2)
library(camcorder)
library(showtext)
library(glue)
library(ggtext)

# Load TidyTuesday data
tuesdata <- tidytuesdayR::tt_load(2023, week = 5)
cats_uk <- tuesdata$cats_uk
cats_uk_reference <- tuesdata$cats_uk_reference

# Explore data
View(cats_uk_reference)
plot(
  x = cats_uk$location_long,
  y = cats_uk$location_lat
)
hist(
  x = cats_uk$ground_speed
)
plot(
  x = cats_uk_reference$age_years,
  y = cats_uk_reference$hrs_indoors
)
nrow(cats_uk_reference)

# Data wrangling
plot_data <- cats_uk_reference |>
  select(age_years, hrs_indoors) |>
  mutate(hrs_indoors = factor(hrs_indoors)) |>
  count(age_years, hrs_indoors) |>
  drop_na()

# Basic plot
base_plot <- ggplot(
  data = plot_data,
  mapping = aes(
    x = age_years,
    y = hrs_indoors,
    size = n
  )
) +
  geom_point()
base_plot

# Set up camcorder
gg_record(width = 6, height = 4)

# Colours
text_col <- "grey10"
bg_col <- "grey95"
highlight_col <- "#261447"

# Update point colour, legend breaks
base_plot <- ggplot(
  data = plot_data,
  mapping = aes(
    x = age_years,
    y = hrs_indoors
  )
) +
  geom_point(
    colour = highlight_col,
    mapping = aes(size = n)
  ) +
  scale_size(breaks = c(3, 6, 9))
base_plot

# Fonts from Google Fonts
font_add_google("Ubuntu")
font_add_google("Chewy")
showtext_auto()
showtext_opts(dpi = 300)
title_font <- "Chewy"
body_font <- "Ubuntu"

# Annotation text
annotation_oldest <- cats_uk_reference |>
  slice_max(age_years) |>
  mutate(
    label = glue(
      "The oldest cat is {animal_id} who is {age_years} years old."
    )
  ) |>
  select(hrs_indoors, age_years, label)

# Add annotation to plot
annotated_plot <- base_plot +
  geom_textbox(
    data = annotation_oldest,
    mapping = aes(
      x = age_years,
      y = factor(hrs_indoors),
      label = label
    )
  )

# Better annotation with ggtext
annotated_plot <- base_plot +
  geom_textbox(
    data = annotation_oldest,
    mapping = aes(
      x = age_years - 2.5,
      y = factor(hrs_indoors),
      label = label
    ),
    maxwidth = unit(1, "in"),
    halign = 0.5,
    hjust = 0.5,
    size = 2.5,
    family = body_font,
    color = text_col
  )
annotated_plot

# Add title and subtitle text
perc_indoor <- round(100 * (sum(
  cats_uk_reference$hrs_indoors == "22.5"
) / nrow(cats_uk_reference)))
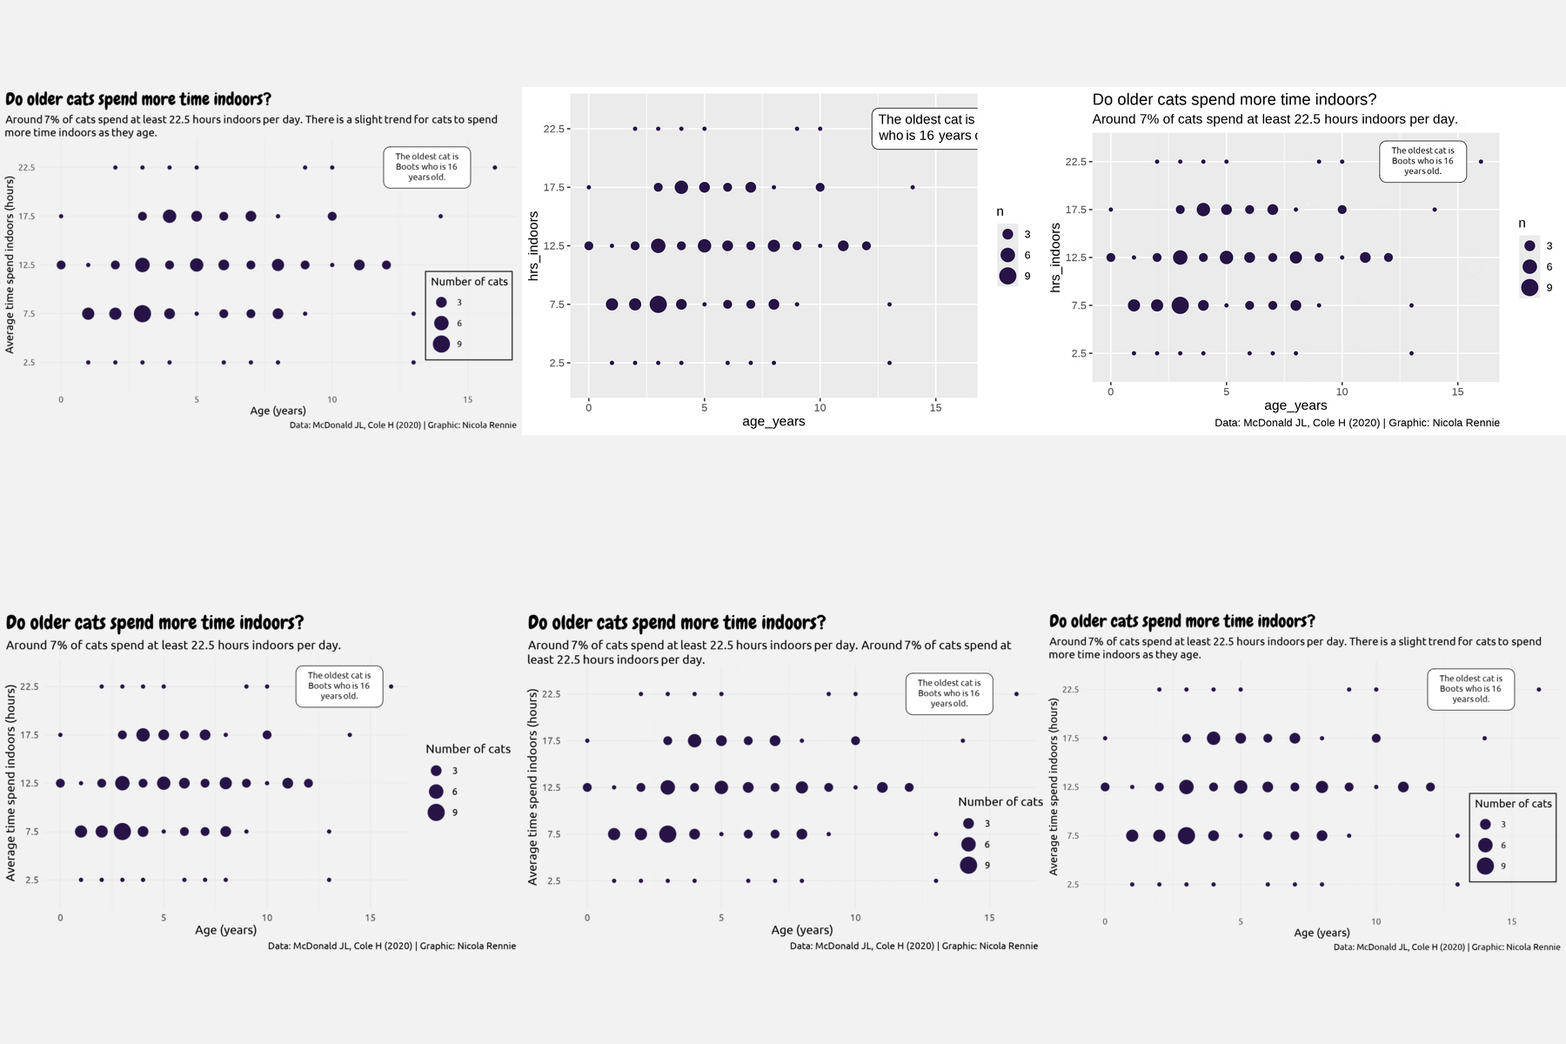
title <- "Do older cats spend more time indoors?"
subtitle <- glue(
  "Around {perc_indoor}% of cats spend at least 22.5 hours indoors per day. There is a slight trend for cats to spend more time indoors as they age."
)
cap <- "Data: McDonald JL, Cole H (2020) | Graphic: Nicola Rennie"

# Add text to plot
text_plot <- annotated_plot +
  labs(
    title = title,
    subtitle = subtitle,
    caption = cap,
    x = "Age (years)",
    y = "Average time spend indoors (hours)",
    size = "Number of cats"
  )

# Theme styling
text_plot +
  theme_minimal(
    base_family = body_font,
    base_size = 9
  ) +
  theme(
    plot.title.position = "plot",
    plot.caption.position = "plot",
    plot.title = element_text(
      family = title_font,
      size = rel(1.6)
    ),
    plot.subtitle = element_textbox_simple(),
    legend.position = "inside",
    legend.position.inside = c(0.9, 0.3),
    legend.background = element_rect(
      fill = alpha(bg_col, 0.6),
      colour = text_col
    )
  )

# Save
ggsave(filename = "cats.png", width = 6, height = 4)

# Save with non-transparent background
ggsave(filename = "cats.png", width = 6, height = 4, bg = bg_col)

# Save gif with camcorder
gg_playback("cats.gif", background = bg_col)
The gif showing the process of building the chart was recorded with {camcorder}:
