library(gapminder)Exercises
Data
Load the gapminder data:
Exercises
Exercise 1: Parameterized plots with ggplot2
- Create a variable to define a year in the
gapminderdata that you want to plot.
Solution
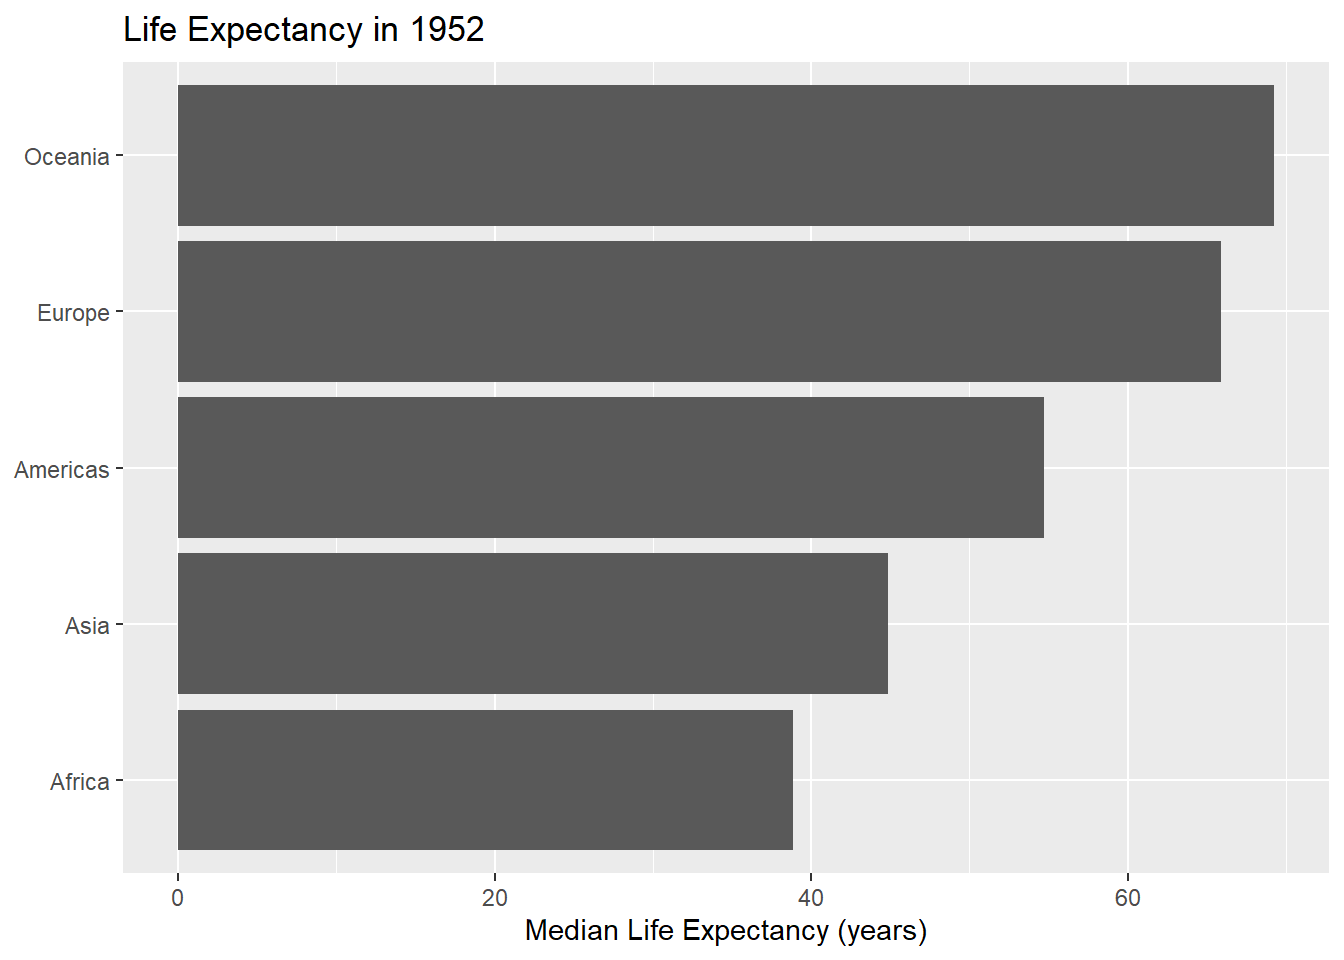
choose_year <- 1952- Edit the code below to use this new year variable.
library(dplyr)
library(ggplot2)
# Median life expectancy per continent
gapminder_1952 <- gapminder |>
  filter(year == 1952) |>
  group_by(continent) |>
  summarise(
    median_lifeExp = median(lifeExp)
  )
# Bar chart
ggplot(data = gapminder_1952) +
  geom_col(
    mapping = aes(
      x = median_lifeExp,
      y = reorder(continent, median_lifeExp)
    )
  ) +
  labs(
    x = "Median Life Expectancy (years)", y = NULL,
    title = "Life Expectancy in 1952"
  )
Solution
library(dplyr)
library(ggplot2)
library(glue)

# Median life expectancy per continent
gapminder_year <- gapminder |>
  filter(year == choose_year) |>
  group_by(continent) |>
  summarise(
    median_lifeExp = median(lifeExp)
  )

# Bar chart
ggplot(data = gapminder_year) +
  geom_col(
    mapping = aes(
      x = median_lifeExp,
      y = reorder(continent, median_lifeExp)
    )
  ) +
  labs(
    x = "Median Life Expectancy (years)", y = NULL,
    title = glue("Life Expectancy in {choose_year}")
  )
- Turn your code into a function that takes the data and year variable as arguments.
Solution
barchart_year <- function(choose_year, data = gapminder) {
  # Median life expectancy per continent
  gapminder_year <- gapminder |>
    filter(year == choose_year) |>
    group_by(continent) |>
    summarise(
      median_lifeExp = median(lifeExp)
    )
  # Bar chart
  g <- ggplot(data = gapminder_year) +
    geom_col(
      mapping = aes(
        x = median_lifeExp,
        y = reorder(continent, median_lifeExp)
      )
    ) +
    labs(
      x = "Median Life Expectancy (years)", y = NULL,
      title = glue("Life Expectancy in {choose_year}")
    )
  return(g)
}
Check it works:
barchart_year(2002)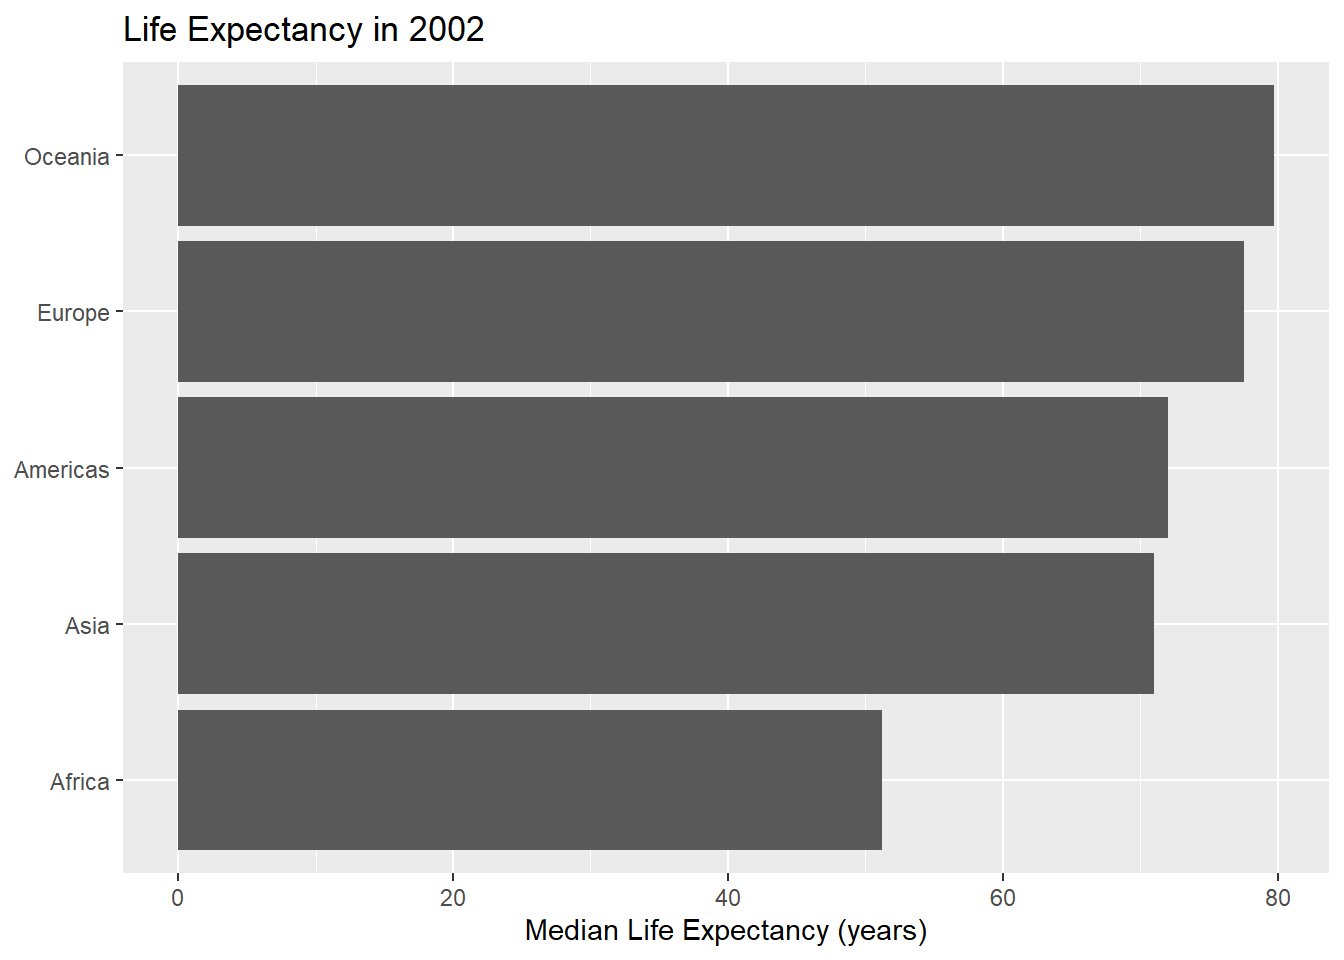
- Bonus: Add another argument to your function that allows a user to define the bar colour.
Solution
barchart_year <- function(
    choose_year, fill = "blue", data = gapminder) {
  # Median life expectancy per continent
  gapminder_year <- gapminder |>
    filter(year == choose_year) |>
    group_by(continent) |>
    summarise(
      median_lifeExp = median(lifeExp)
    )
  # Bar chart
  g <- ggplot(data = gapminder_year) +
    geom_col(
      mapping = aes(
        x = median_lifeExp,
        y = reorder(continent, median_lifeExp)
      ),
      fill = fill
    ) +
    labs(
      x = "Median Life Expectancy (years)", y = NULL,
      title = glue("Life Expectancy in {choose_year}")
    )
  return(g)
}
Check it works:
barchart_year(2002, fill = "purple")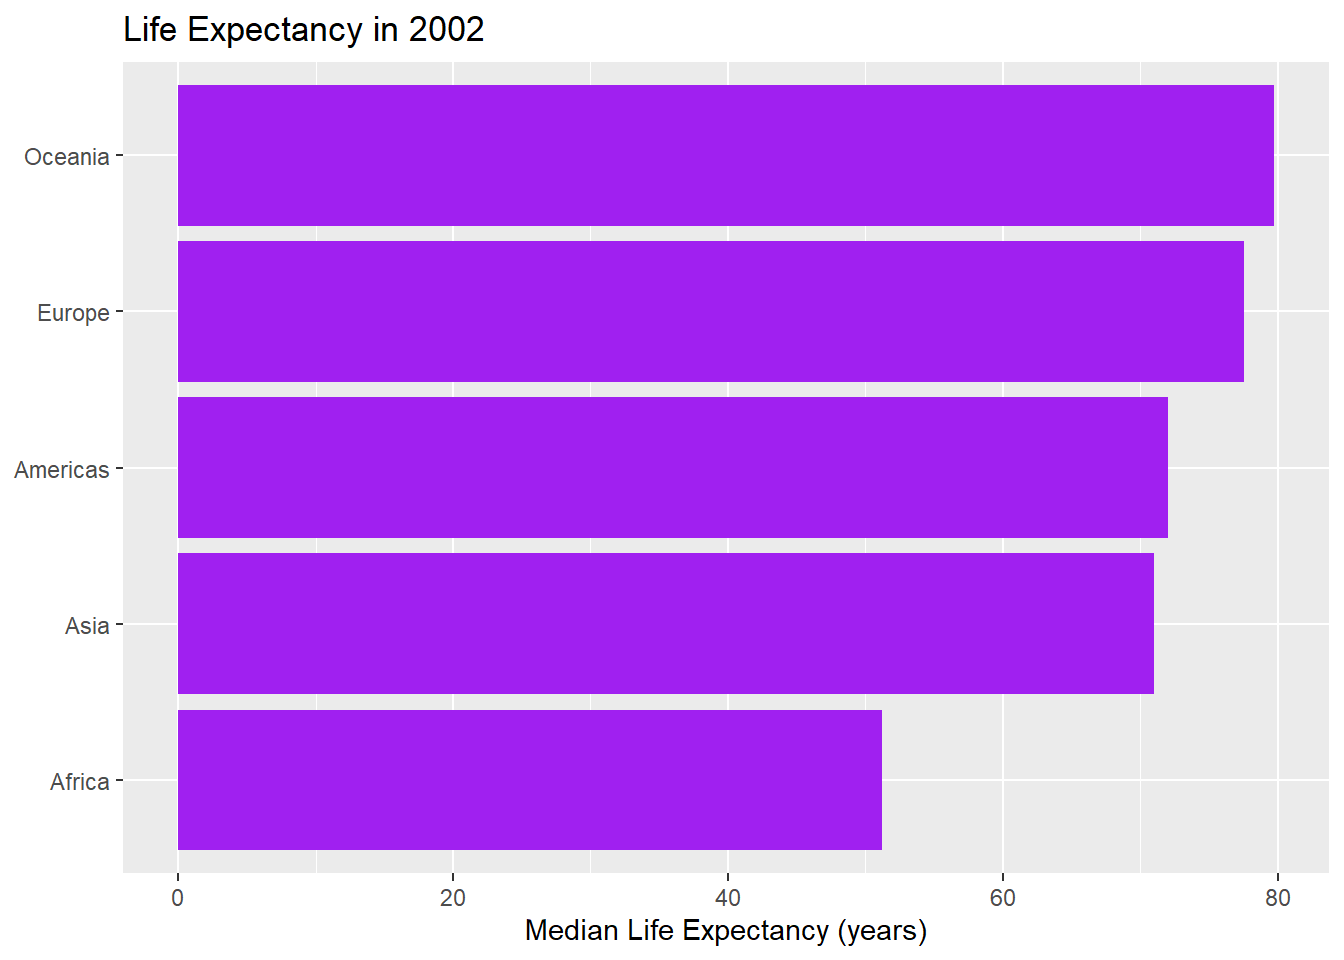
- Bonus: How could you improve your function?
Solution
- Not all year values are included in the data. Add a check that the value is a number that is included in the
gapminderdata. if it isn’t, add a more useful message. - Write some documentation!
Exercise 2: Parameterized reports with Quarto
- Edit the
report.qmdfile to add a parameter for year.
Warningreport.qmd
---
title: "Gapminder Report: 1952"
execute:
  echo: false
---

```{r}
#| label: load-pkgs
#| warning: false
library(gapminder)
library(dplyr)
library(ggplot2)
library(glue)
```

This is a report using the [Gapminder](https://www.gapminder.org/data/) data. @fig-life-exp shows a plot of the median life expectancy in the year 1952 for each continent.

```{r}
#| label: fig-life-exp
#| fig-cap: "Life expectancy in 1952"
# Edit the code below with your plot function!
plot(1:10, 1:10)
```
Solution
---
title: "Gapminder Report: 1952"
execute:
  echo: false
params:
  choose_year: 1952
---

```{r}
#| label: load-pkgs
#| warning: false
library(gapminder)
library(dplyr)
library(ggplot2)
library(glue)
```

This is a report using the [Gapminder](https://www.gapminder.org/data/) data. @fig-life-exp shows a plot of the median life expectancy in the year 1952 for each continent.

```{r}
#| label: fig-life-exp
#| fig-cap: "Life expectancy in 1952"
# Edit the code below with your plot function!
plot(1:10, 1:10)
```- Add your plotting function to the quarto document, and pass the parameter into the plotting function. Check it renders.
Solution
---
title: "Gapminder Report: 1952"
execute:
  echo: false
params:
  choose_year: 1952
---

```{r}
#| label: load-pkgs
#| warning: false
library(gapminder)
library(dplyr)
library(ggplot2)
library(glue)
```

This is a report using the [Gapminder](https://www.gapminder.org/data/) data. @fig-life-exp shows a plot of the median life expectancy in the year 1952 for each continent.

```{r}
#| label: fig-life-exp
#| fig-cap: "Life expectancy in 1952"
barchart_year <- function(
    choose_year, fill = "blue", data = gapminder) {
  # Median life expectancy per continent
  gapminder_year <- gapminder |>
    filter(year == choose_year) |>
    group_by(continent) |>
    summarise(
      median_lifeExp = median(lifeExp)
    )
  # Bar chart
  g <- ggplot(data = gapminder_year) +
    geom_col(
      mapping = aes(
        x = median_lifeExp,
        y = reorder(continent, median_lifeExp)
      ),
      fill = fill
    ) +
    labs(
      x = "Median Life Expectancy (years)", y = NULL,
      title = glue("Life Expectancy in {choose_year}")
    )
  return(g)
}
barchart_year(params$choose_year)
```- Change the value of the parameter, and re-render.
Exercise 3: Parameterized text with Quarto
- Edit the sentence
...a plot of the median life expectancy in the year 1952 for each continent...to use inline code to add the document parameter for the year.
Solution
---
title: "Gapminder Report: 1952"
execute:
  echo: false
params:
  choose_year: 1952
---

```{r}
#| label: load-pkgs
#| warning: false
library(gapminder)
library(dplyr)
library(ggplot2)
library(glue)
```

This is a report using the [Gapminder](https://www.gapminder.org/data/) data. @fig-life-exp shows a plot of the median life expectancy in the year `r params$choose_year` for each continent.

```{r}
#| label: fig-life-exp
#| fig-cap: "Life expectancy in 1952"
barchart_year <- function(
    choose_year, fill = "blue", data = gapminder) {
  # Median life expectancy per continent
  gapminder_year <- gapminder |>
    filter(year == choose_year) |>
    group_by(continent) |>
    summarise(
      median_lifeExp = median(lifeExp)
    )
  # Bar chart
  g <- ggplot(data = gapminder_year) +
    geom_col(
      mapping = aes(
        x = median_lifeExp,
        y = reorder(continent, median_lifeExp)
      ),
      fill = fill
    ) +
    labs(
      x = "Median Life Expectancy (years)", y = NULL,
      title = glue("Life Expectancy in {choose_year}")
    )
  return(g)
}
barchart_year(params$choose_year)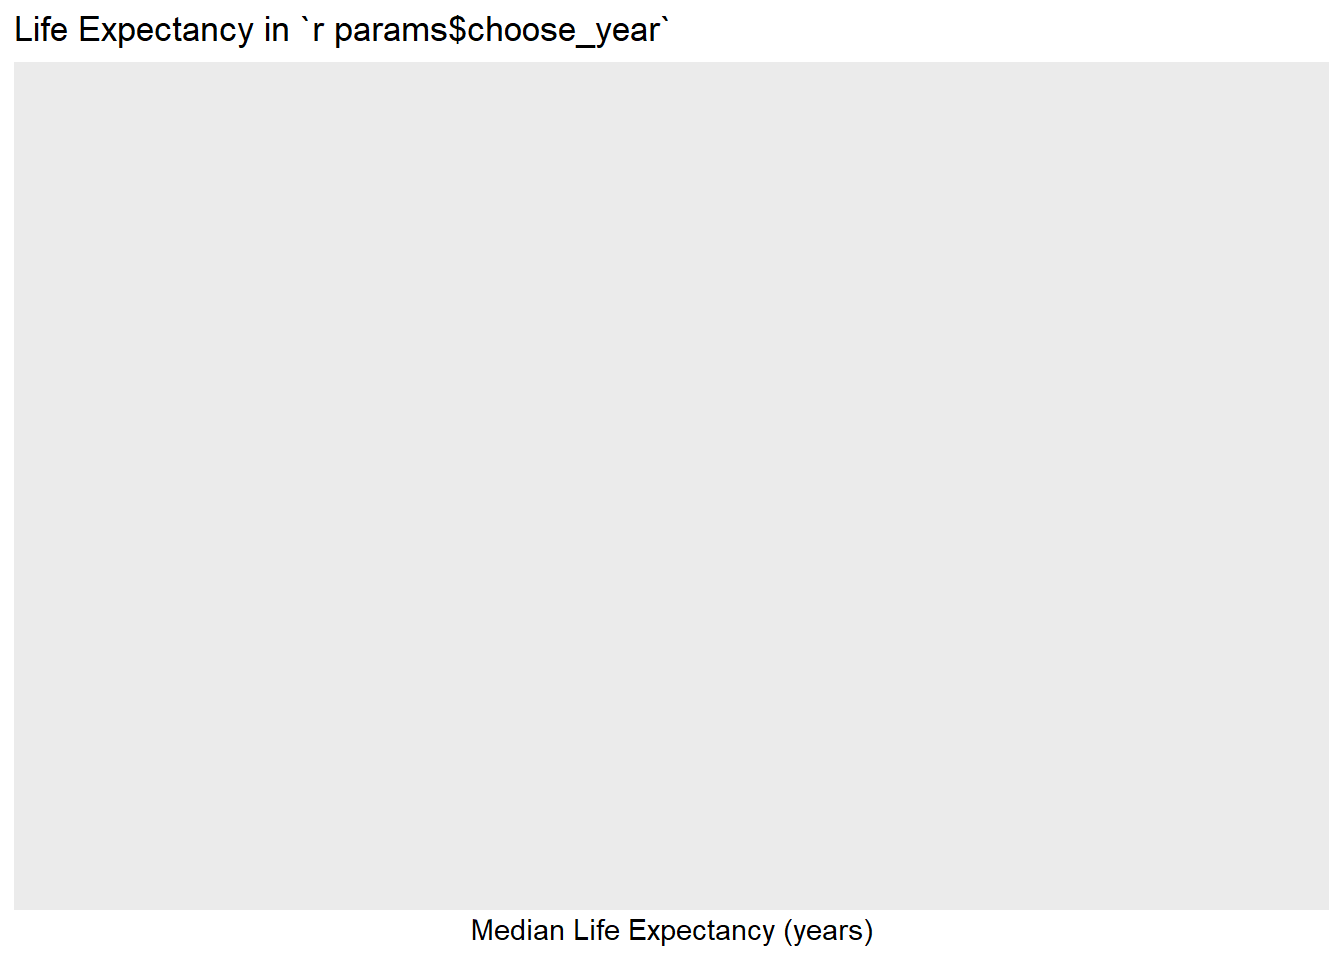
```- Use inline code for the title as well.
Solution
---
title: "Gapminder Report: `r params$choose_year`"
execute:
  echo: false
params:
  choose_year: 1952
---

```{r}
#| label: load-pkgs
#| warning: false
library(gapminder)
library(dplyr)
library(ggplot2)
library(glue)
```

This is a report using the [Gapminder](https://www.gapminder.org/data/) data. @fig-life-exp shows a plot of the median life expectancy in the year `r params$choose_year` for each continent.

```{r}
#| label: fig-life-exp
#| fig-cap: "Life expectancy in 1952"
barchart_year <- function(
    choose_year, fill = "blue", data = gapminder) {
  # Median life expectancy per continent
  gapminder_year <- gapminder |>
    filter(year == choose_year) |>
    group_by(continent) |>
    summarise(
      median_lifeExp = median(lifeExp)
    )
  # Bar chart
  g <- ggplot(data = gapminder_year) +
    geom_col(
      mapping = aes(
        x = median_lifeExp,
        y = reorder(continent, median_lifeExp)
      ),
      fill = fill
    ) +
    labs(
      x = "Median Life Expectancy (years)", y = NULL,
      title = glue("Life Expectancy in {choose_year}")
    )
  return(g)
}
barchart_year(params$choose_year)
```- Edit the figure caption to use inline code to add the document parameter for the year.
Solution
---
title: "Gapminder Report: `r params$choose_year`"
execute:
  echo: false
params:
  choose_year: 1952
---

```{r}
#| label: load-pkgs
#| warning: false
library(gapminder)
library(dplyr)
library(ggplot2)
library(glue)
```

This is a report using the [Gapminder](https://www.gapminder.org/data/) data. @fig-life-exp shows a plot of the median life expectancy in the year `r params$choose_year` for each continent.

```{r}
#| label: fig-life-exp
#| fig-cap: !expr 'paste("Life expectancy in ", params$choose_year)'
barchart_year <- function(
    choose_year, fill = "blue", data = gapminder) {
  # Median life expectancy per continent
  gapminder_year <- gapminder |>
    filter(year == choose_year) |>
    group_by(continent) |>
    summarise(
      median_lifeExp = median(lifeExp)
    )
  # Bar chart
  g <- ggplot(data = gapminder_year) +
    geom_col(
      mapping = aes(
        x = median_lifeExp,
        y = reorder(continent, median_lifeExp)
      ),
      fill = fill
    ) +
    labs(
      x = "Median Life Expectancy (years)", y = NULL,
      title = glue("Life Expectancy in {choose_year}")
    )
  return(g)
}
barchart_year(params$choose_year)
```
Exercise 4: Rendering multiple reports
- Render a version of your report for the year
1972using thequarto_render()function.
Solution
quarto_render(
  input = "report.qmd",
  execute_params = list(choose_year = 1972)
)- Render a version of your report for all years in the data.
Solution
walk(
  .x = unique(gapminder$year),
  .f = ~quarto_render(
    input = "report.qmd",
    output_file = glue("report_{.x}.html"),
    execute_params = list(
      choose_year = .x
    )
  )
)
Exercise 5: Conditional content
- Edit the .qmd file from Exercise 3. When the format is HTML show an interactive chart using
plotly, otherwise show a static chart.
Solution
---
title: "Gapminder Report: `r params$choose_year`"
execute:
  echo: false
params:
  choose_year: 1952
---

```{r}
#| label: load-pkgs
#| warning: false
library(gapminder)
library(dplyr)
library(ggplot2)
library(glue)
library(plotly)
```

This is a report using the [Gapminder](https://www.gapminder.org/data/) data. @fig-life-exp shows a plot of the median life expectancy in the year `r params$choose_year` for each continent.

```{r}
barchart_year <- function(
    choose_year, fill = "blue", data = gapminder) {
  # Median life expectancy per continent
  gapminder_year <- gapminder |>
    filter(year == choose_year) |>
    group_by(continent) |>
    summarise(
      median_lifeExp = median(lifeExp)
    )
  # Bar chart
  g <- ggplot(data = gapminder_year) +
    geom_col(
      mapping = aes(
        x = median_lifeExp,
        y = reorder(continent, median_lifeExp)
      ),
      fill = fill
    ) +
    labs(
      x = "Median Life Expectancy (years)", y = NULL,
      title = glue("Life Expectancy in {choose_year}")
    )
  return(g)
}
plot_output <- barchart_year(params$choose_year)
```

::: {#fig-life-exp fig-cap="Life expectancy in `r params$choose_year`"}

::: {.content-visible when-format="html"}

```{r}
ggplotly(plot_output)
```

:::

::: {.content-visible unless-format="html"}

```{r}
plot_output
```

:::

:::
- When the year parameter is 2007, add a sentence to state that it is the most recent data available.
Solution
---
title: "Gapminder Report: `r params$choose_year`"
execute:
  echo: false
params:
  choose_year: 1952
---

```{r}
#| label: load-pkgs
#| warning: false
library(gapminder)
library(dplyr)
library(ggplot2)
library(glue)
library(plotly)
```

This is a report using the [Gapminder](https://www.gapminder.org/data/) data. @fig-life-exp shows a plot of the median life expectancy in the year `r params$choose_year` for each continent.

```{r}
barchart_year <- function(
    choose_year, fill = "blue", data = gapminder) {
  # Median life expectancy per continent
  gapminder_year <- gapminder |>
    filter(year == choose_year) |>
    group_by(continent) |>
    summarise(
      median_lifeExp = median(lifeExp)
    )
  # Bar chart
  g <- ggplot(data = gapminder_year) +
    geom_col(
      mapping = aes(
        x = median_lifeExp,
        y = reorder(continent, median_lifeExp)
      ),
      fill = fill
    ) +
    labs(
      x = "Median Life Expectancy (years)", y = NULL,
      title = glue("Life Expectancy in {choose_year}")
    )
  return(g)
}
plot_output <- barchart_year(params$choose_year)
```

::: {#fig-life-exp fig-cap="Life expectancy in `r params$choose_year`"}

::: {.content-visible when-format="html"}

```{r}
ggplotly(plot_output)
```

:::

::: {.content-visible unless-format="html"}

```{r}
plot_output
```

:::

:::

```{r}
latest_begin <- if (params$choose_year != 2007) "::: {.content-hidden}"
latest_end <- if (params$choose_year != 2007) ":::"
```

`r latest_begin`

This is the most recent data available.

`r latest_end`
- Bonus: Can you edit the logic you applied in question 2, to check programmatically if it’s the last year in the data?
Solution
last_year <- max(gapminder$year)
latest_begin <- if (params$choose_year != last_year) "::: {.content-hidden}"
latest_end <- if (params$choose_year != last_year) ":::"
Exercise 6: Parameterized report sections
Separate out the
barchart_year()function into a separate R script.Load it in using
file:instead.
Solution
Create a .R file and put the function in it. You don’t need to make any changes.
setup.R
barchart_year <- function(
    choose_year, fill = "blue", data = gapminder) {
  # Median life expectancy per continent
  gapminder_year <- gapminder |>
    filter(year == choose_year) |>
    group_by(continent) |>
    summarise(
      median_lifeExp = median(lifeExp)
    )
  # Bar chart
  g <- ggplot(data = gapminder_year) +
    geom_col(
      mapping = aes(
        x = median_lifeExp,
        y = reorder(continent, median_lifeExp)
      ),
      fill = fill
    ) +
    labs(
      x = "Median Life Expectancy (years)", y = NULL,
      title = glue("Life Expectancy in {choose_year}")
    )
  return(g)
}
The use file: to load it in.
---
title: "Gapminder Report: `r params$choose_year`"
execute:
echo: false
params:
choose_year: 1952
---
```{r}
#| label: load-pkgs
#| warning: false
library(gapminder)
library(dplyr)
library(ggplot2)
library(glue)
```
```{r}
#| file: setup.R
```
This is a report using the [Gapminder](https://www.gapminder.org/data/) data. @fig-life-exp shows a plot of the median life expectancy in the year `r params$choose_year` for each continent.
::: {.cell}
```{.r .cell-code}
barchart_year(params$choose_year)
```
::: {.cell-output-display}
{#fig-life-exp width=672}
:::
:::
- Create a child file containing the year as a section heading, followed by the chart.
Solution
- Render document with a section for each year in the data.
Solution
---
title: "Gapminder Report
execute:
  echo: false
---

```{r}
#| label: load-pkgs
#| warning: false
library(gapminder)
library(dplyr)
library(ggplot2)
library(glue)
```

```{r}
#| file: setup.R
```

```{r}
#| output: asis
all_years <- as.character(unique(gapminder$year))
for (i in seq_len(length(all_years))) {
  params <- list(choose_year = all_years[i])
  a <- knitr::knit_child('_child.qmd', quiet = TRUE)
  cat(a, sep='\n')
}
```