library(gapminder)Examples
Data
Load the gapminder data:
Examples
This section includes code for the examples shown. These may differ slightly from the examples shown in the live demonstration.
Example 1: Parameterized plots with ggplot2
See example
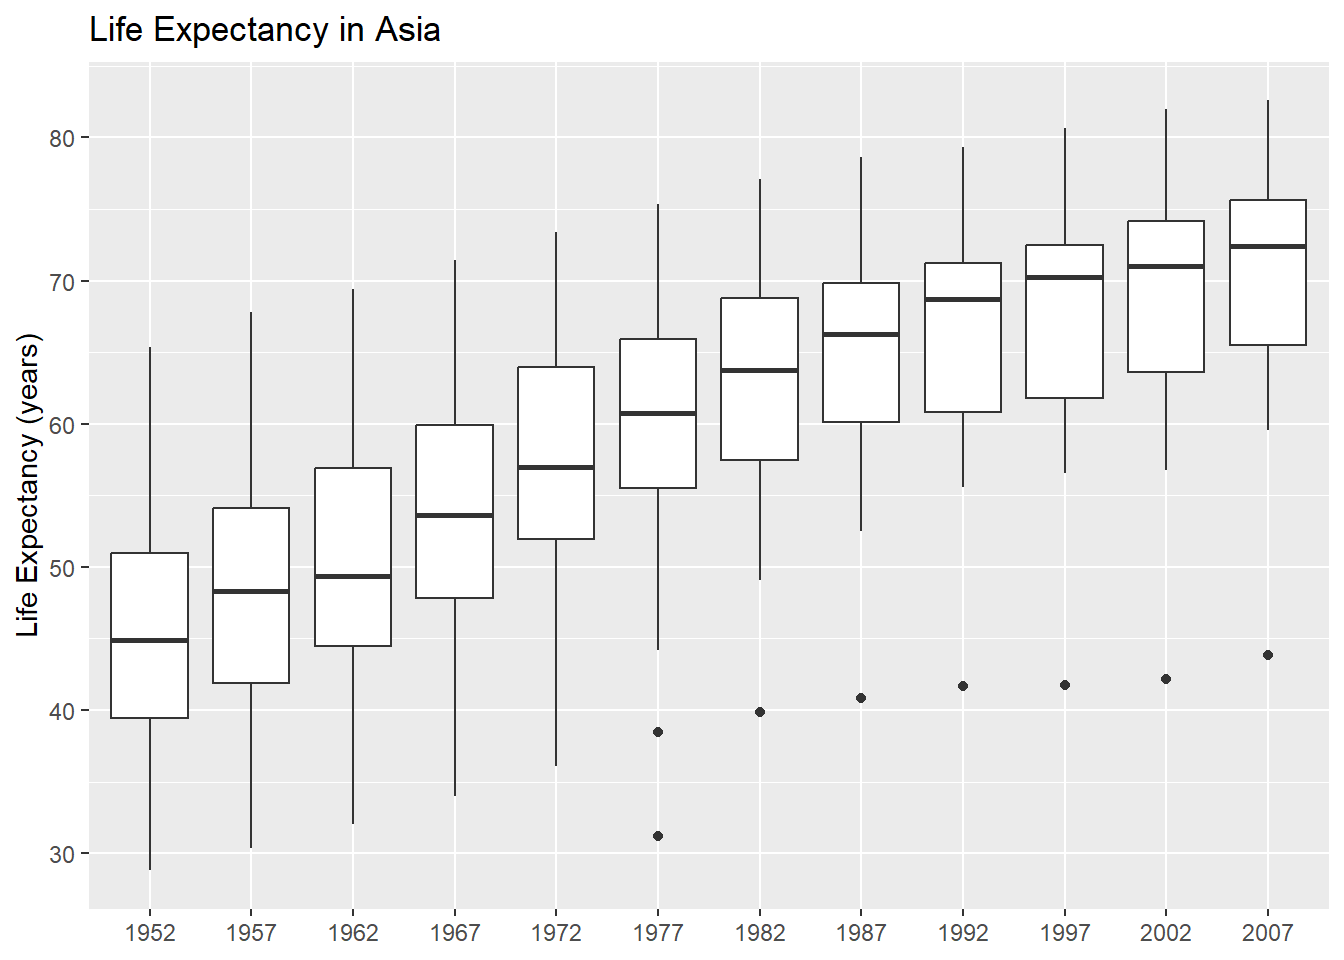
Let’s make a plot of how the life expectancy has changed in Asia over time. We start by filtering the data:
library(dplyr)
gapminder_asia <- gapminder |>
  filter(continent == "Asia")
We then make a plot:
library(ggplot2)
ggplot(data = gapminder_asia) +
  geom_boxplot(
    mapping = aes(x = factor(year), y = lifeExp)
  ) +
  labs(
    x = NULL, y = "Life Expectancy (years)",
    title = "Life Expectancy in Asia"
  )
If we wanted to create the same plot but for Europe, what would we need to change?
- The value that the data is filtered on
- The text in the title
Let’s create a variable for the continent:
choose_continent <- "Asia"and then use that value in our code:
# Filter data
gapminder_continent <- gapminder |>
  filter(continent == choose_continent)

# Plot
library(glue)
ggplot(data = gapminder_continent) +
  geom_boxplot(
    mapping = aes(x = factor(year), y = lifeExp)
  ) +
  labs(
    x = NULL, y = "Life Expectancy (years)",
    title = glue("Life Expectancy in {choose_continent}")
  )
This makes it easier to turn it into a function:
continent_plot <- function(choose_continent, data = gapminder) {
  # Filter data
  gapminder_continent <- data |>
    filter(continent == choose_continent)
  # Plot
  g <- ggplot(data = gapminder_continent) +
    geom_boxplot(
      mapping = aes(x = factor(year), y = lifeExp)
    ) +
    labs(
      x = NULL, y = "Life Expectancy (years)",
      title = glue("Life Expectancy in {choose_continent}")
    )
  return(g)
}
Check it works:
continent_plot("Europe")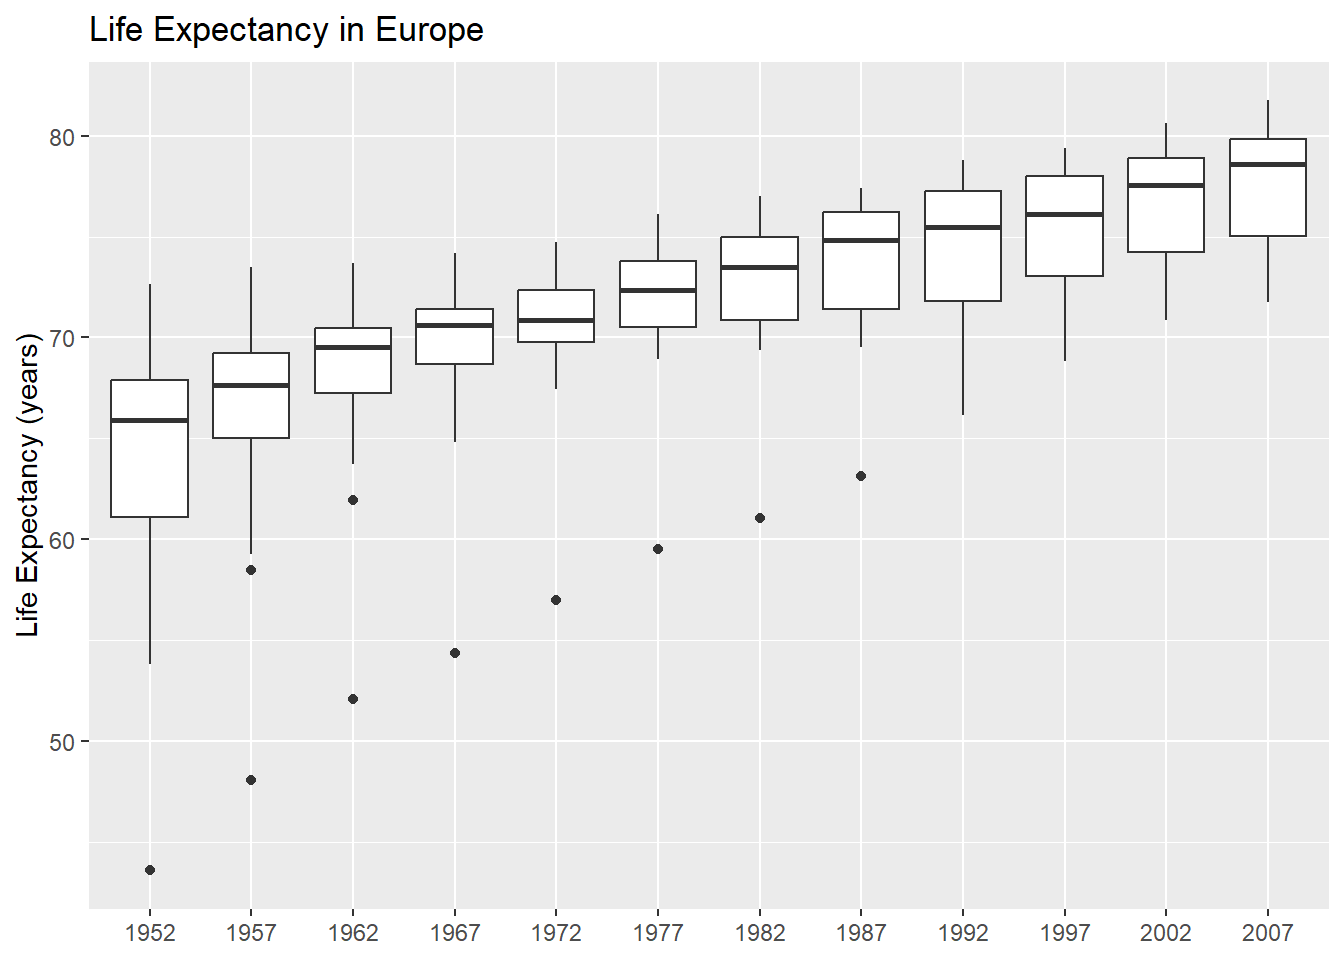
Example 2: Parameterized reports with Quarto
See example
Here’s a file, example.qmd, we’ll use as a template for our report:
Let’s start by editing the example.qmd file to add a document parameter for the continent.
---
title: "Gapminder Report on Life Expectancy in Asia"
execute:
  echo: false
params:
  choose_continent: "Europe"
---

```{r}
#| label: load-pkgs
#| warning: false
library(gapminder)
library(dplyr)
library(ggplot2)
library(glue)
```

This is a report using the [Gapminder](https://www.gapminder.org/data/) data. @fig-life-exp shows a box plot of how the life expectancy in Asia has changed over time.

```{r}
#| label: fig-life-exp
#| fig-cap: "Life expectancy in Asia"
# Edit the code below with your plot function!
plot(1:10, 1:10)
```
Then, we add our plotting function, and pass in the parameter:
---
title: "Gapminder Report on Life Expectancy in Asia"
execute:
  echo: false
params:
  choose_continent: "Europe"
---

```{r}
#| label: load-pkgs
#| warning: false
library(gapminder)
library(dplyr)
library(ggplot2)
library(glue)
```

This is a report using the [Gapminder](https://www.gapminder.org/data/) data. @fig-life-exp shows a box plot of how the life expectancy in Asia has changed over time.

```{r}
#| label: fig-life-exp
#| fig-cap: "Life expectancy in Asia"
continent_plot <- function(choose_continent, data = gapminder) {
  # Filter data
  gapminder_continent <- data |>
    filter(continent == choose_continent)
  # Plot
  g <- ggplot(data = gapminder_continent) +
    geom_boxplot(
      mapping = aes(x = factor(year), y = lifeExp)
    ) +
    labs(
      x = NULL, y = "Life Expectancy (years)",
      title = glue("Life Expectancy in {params$choose_continent}")
    )
  return(g)
}
continent_plot(params$choose_continent)
```
We can use the parameter multiple times e.g. to add a table
---
title: "Gapminder Report on Life Expectancy in Asia"
execute:
  echo: false
params:
  choose_continent: "Europe"
---

```{r}
#| label: load-pkgs
#| warning: false
library(gapminder)
library(dplyr)
library(ggplot2)
library(glue)
```

This is a report using the [Gapminder](https://www.gapminder.org/data/) data. @fig-life-exp shows a box plot of how the life expectancy in Asia has changed over time.

```{r}
#| label: fig-life-exp
#| fig-cap: "Life expectancy in Asia"
continent_plot <- function(choose_continent, data = gapminder) {
  # Filter data
  gapminder_continent <- data |>
    filter(continent == choose_continent)
  # Plot
  g <- ggplot(data = gapminder_continent) +
    geom_boxplot(
      mapping = aes(x = factor(year), y = lifeExp)
    ) +
    labs(
      x = NULL, y = "Life Expectancy (years)",
      title = glue("Life Expectancy in {params$choose_continent}")
    )
  return(g)
}
continent_plot(params$choose_continent)
```

Adding a table of data:


```{r}
#| label: tbl-stats
#| tbl-cap: "Statistics in Asia"
library(tinytable)
gapminder |>
  filter(continent == params$choose_continent) |>
  group_by(year) |>
  summarise(across(c(lifeExp, pop, gdpPercap), mean)) |>
  tt()
```
Example 3: Parameterized text with Quarto
See example
Add inline code:
The number of rows is `r nrow(gapminder)`.
which displays as:
The number of rows is 1704.
We can apply this to our document and use the parameters inline:
---
title: "Gapminder Report on Life Expectancy in Asia"
execute:
  echo: false
params:
  choose_continent: "Europe"
---

```{r}
#| label: load-pkgs
#| warning: false
library(gapminder)
library(dplyr)
library(ggplot2)
library(glue)
```

This is a report using the [Gapminder](https://www.gapminder.org/data/) data. @fig-life-exp shows a box plot of how the life expectancy in `r params$choose_continent` has changed over time.

```{r}
#| label: fig-life-exp
#| fig-cap: "Life expectancy in Asia"
continent_plot <- function(choose_continent, data = gapminder) {
  # Filter data
  gapminder_continent <- data |>
    filter(continent == choose_continent)
  # Plot
  g <- ggplot(data = gapminder_continent) +
    geom_boxplot(
      mapping = aes(x = factor(year), y = lifeExp)
    ) +
    labs(
      x = NULL, y = "Life Expectancy (years)",
      title = glue("Life Expectancy in {params$choose_continent}")
    )
  return(g)
}
continent_plot(params$choose_continent)
```
Including in the title:
---
title: "Gapminder Report on Life Expectancy in `r params$choose_continent`"
execute:
  echo: false
params:
  choose_continent: "Europe"
---

```{r}
#| label: load-pkgs
#| warning: false
library(gapminder)
library(dplyr)
library(ggplot2)
library(glue)
```

This is a report using the [Gapminder](https://www.gapminder.org/data/) data. @fig-life-exp shows a box plot of how the life expectancy in `r params$choose_continent` has changed over time.

```{r}
#| label: fig-life-exp
#| fig-cap: "Life expectancy in Asia"
continent_plot <- function(choose_continent, data = gapminder) {
  # Filter data
  gapminder_continent <- data |>
    filter(continent == choose_continent)
  # Plot
  g <- ggplot(data = gapminder_continent) +
    geom_boxplot(
      mapping = aes(x = factor(year), y = lifeExp)
    ) +
    labs(
      x = NULL, y = "Life Expectancy (years)",
      title = glue("Life Expectancy in {params$choose_continent}")
    )
  return(g)
}
continent_plot(params$choose_continent)
```
We edit the figure caption slightly differently:
---
title: "Gapminder Report on Life Expectancy in `r params$choose_continent`"
execute:
  echo: false
params:
  choose_continent: "Europe"
---

```{r}
#| label: load-pkgs
#| warning: false
library(gapminder)
library(dplyr)
library(ggplot2)
library(glue)
```

This is a report using the [Gapminder](https://www.gapminder.org/data/) data. @fig-life-exp shows a box plot of how the life expectancy in `r params$choose_continent` has changed over time.

```{r}
#| label: fig-life-exp
#| fig-cap: !expr 'paste0("Life expectancy in ", params$choose_continent)'
continent_plot <- function(choose_continent, data = gapminder) {
  # Filter data
  gapminder_continent <- data |>
    filter(continent == choose_continent)
  # Plot
  g <- ggplot(data = gapminder_continent) +
    geom_boxplot(
      mapping = aes(x = factor(year), y = lifeExp)
    ) +
    labs(
      x = NULL, y = "Life Expectancy (years)",
      title = glue("Life Expectancy in {params$choose_continent}")
    )
  return(g)
}
continent_plot(params$choose_continent)
```
Example 4: Rendering multiple reports
See example
Render one report using the quarto R package:
library(quarto)
quarto_render(
  input = "example.qmd",
  execute_params = list(
    continent = "Europe"
  )
)
Use the purrr package to create multiple reports at the same time:
library(purrr)
walk(
  .x = unique(gapminder$continent),
  .f = ~quarto_render(
    input = "example.qmd",
    execute_params = list(
      choose_continent = .x
    )
  )
)
Why is there only one report? We need to give each report a different name, to stop it being overwritten. Let’s use glue() again, this time for the file names.
walk(
  .x = unique(gapminder$continent),
  .f = ~quarto_render(
    input = "example.qmd",
    output_file = glue("report_{.x}.html"),
    execute_params = list(
      choose_continent = .x
    )
  )
)
To ensure the images aren’t overwritten as well, you may need to add embed-resources: true to your Quarto document YAML:
---
format:
  html:
    embed-resources: true
---
This keeps any plots created embedded within the HTML document, instead of in a separate folder.
Example 5: Conditional content
See example
- Split out the plot code from the plot output into two code blocks.
- Remember to keep the figure caption with the plot output.
- The default format is
html. Check what it looks like inpdfby specifying the format. - The cross references don’t work quite correctly out of the box. We have two code blocks with the same figure reference, even though one is hidden. Switch to div syntax.
---
title: "Gapminder Report on Life Expectancy in `r params$choose_continent`"
format: pdf
execute:
  echo: false
params:
  choose_continent: "Europe"
---

```{r}
#| label: load-pkgs
#| warning: false
library(gapminder)
library(dplyr)
library(ggplot2)
library(glue)
library(plotly)
```

This is a report using the [Gapminder](https://www.gapminder.org/data/) data. @fig-life-exp shows a box plot of how the life expectancy in `r params$choose_continent` has changed over time.

```{r}
continent_plot <- function(choose_continent, data = gapminder) {
  # Filter data
  gapminder_continent <- data |>
    filter(continent == choose_continent)
  # Plot
  g <- ggplot(data = gapminder_continent) +
    geom_boxplot(
      mapping = aes(x = factor(year), y = lifeExp)
    ) +
    labs(
      x = NULL, y = "Life Expectancy (years)",
      title = glue("Life Expectancy in {params$choose_continent}")
    )
  return(g)
}
plot_output <- continent_plot(params$choose_continent)
```

::: {#fig-life-exp fig-cap="Life expectancy in `r params$choose_continent`"}

::: {.content-visible when-format="html"}

```{r}
ggplotly(plot_output)
```

:::

::: {.content-visible unless-format="html"}

```{r}
plot_output
```

:::

:::
Make further edits to add a sentence when the continent is Europe.
---
title: "Gapminder Report on Life Expectancy in `r params$choose_continent`"
execute:
  echo: false
params:
  choose_continent: "Europe"
---

```{r}
#| label: load-pkgs
#| warning: false
library(gapminder)
library(dplyr)
library(ggplot2)
library(glue)
library(plotly)
```

This is a report using the [Gapminder](https://www.gapminder.org/data/) data. @fig-life-exp shows a box plot of how the life expectancy in `r params$choose_continent` has changed over time.

```{r}
continent_plot <- function(choose_continent, data = gapminder) {
  # Filter data
  gapminder_continent <- data |>
    filter(continent == choose_continent)
  # Plot
  g <- ggplot(data = gapminder_continent) +
    geom_boxplot(
      mapping = aes(x = factor(year), y = lifeExp)
    ) +
    labs(
      x = NULL, y = "Life Expectancy (years)",
      title = glue("Life Expectancy in {params$choose_continent}")
    )
  return(g)
}
plot_output <- continent_plot(params$choose_continent)
```

::: {#fig-life-exp fig-cap="Life expectancy in `r params$choose_continent`"}

::: {.content-visible when-format="html"}

```{r}
ggplotly(plot_output)
```

:::

::: {.content-visible unless-format="html"}

```{r}
plot_output
```

:::

:::

```{r}
eur_begin <- if (params$choose_continent != "Europe") "::: {.content-hidden}"
eur_end <- if (params$choose_continent != "Europe") ":::"
```

`r eur_begin`

Some caveats about the European data are included here.

`r eur_end`
Example 6: Parameterized report sections
See example
Create a .R file and put the function in it. You don’t need to make any changes.
setup.R
continent_plot <- function(choose_continent, data = gapminder) {
  # Filter data
  gapminder_continent <- data |>
    filter(continent == choose_continent)
  # Plot
  g <- ggplot(data = gapminder_continent) +
    geom_boxplot(
      mapping = aes(x = factor(year), y = lifeExp)
    ) +
    labs(
      x = NULL, y = "Life Expectancy (years)",
      title = glue("Life Expectancy in {params$choose_continent}")
    )
  return(g)
}
The use file: to load it in.
---
title: "Gapminder Report on Life Expectancy in `r params$choose_continent`"
execute:
echo: false
params:
choose_continent: "Europe"
---
```{r}
#| label: load-pkgs
#| warning: false
library(gapminder)
library(dplyr)
library(ggplot2)
library(glue)
```
```{r}
#| file: setup.R
```
This is a report using the [Gapminder](https://www.gapminder.org/data/) data. @fig-life-exp shows a box plot of how the life expectancy in `r params$choose_continent` has changed over time.
::: {.cell}
```{.r .cell-code}
continent_plot(params$choose_continent)
```
::: {.cell-output-display}
{#fig-life-exp width=672}
:::
:::
Create a child document containing a section heading and the plot code.
Then call it in the main file with knit_child(), and check it works for one continent. Set output to asis so that Quarto renders the Markdown content correctly, and run it with quiet = TRUE to stop the rendering messages from coming through.
---
title: "Gapminder Report on Life Expectancy
execute:
  echo: false
---

```{r}
#| label: load-pkgs
#| warning: false
library(gapminder)
library(dplyr)
library(ggplot2)
library(glue)
```

```{r}
#| file: setup.R
```

```{r}
#| output: asis
params <- list(choose_continent = "Europe")
a <- knitr::knit_child('_child.qmd', quiet = TRUE)
cat(a, sep='\n')
```
The we can loop over all continents.
---
title: "Gapminder Report on Life Expectancy
execute:
  echo: false
---

```{r}
#| label: load-pkgs
#| warning: false
library(gapminder)
library(dplyr)
library(ggplot2)
library(glue)
```

```{r}
#| file: setup.R
```

```{r}
#| output: asis
all_continents <- as.character(unique(gapminder$continent))
for (i in seq_len(length(all_continents))) {
  params <- list(choose_continent = all_continents[i])
  a <- knitr::knit_child('_child.qmd', quiet = TRUE)
  cat(a, sep='\n')
}
```