Parameterized plots and reports with R and Quarto
Last week I ran a workshop on Parameterized plots and reports with R and Quarto as part of the R/Pharma conference, which I thoroughly enjoyed! There were lots of interesting questions from attendees during the workshop, some of which we didn’t quite have time to get to during the workshop. So this blog post will attempt to answer those questions, alongside highlighting some interesting tips and other frequently asked questions.
The workshop materials (including slides, examples, exercise solutions, and links to other resources) can be found on the workshop website.
R-related questions
What’s the difference between
glue()andpaste()?Both functions allow you to combine variables with text to form strings in R.
paste()(andpaste0()) is a base R version, so it has the benefit of not adding any additional package dependencies to your code.glue()is the {tidyverse} version, which I personally find results in more readable code. Either approach will work well for parameterized plots!Why do we add
dataas an argument, and is it safe to do so?Consider the two functions below (assuming both the
{gapminder}and{dplyr}packages are loaded):# Function 1 filter_data <- function(choose_continent) { gapminder_continent <- gapminder |> filter(continent == choose_continent) return(gapminder_continent) } # Function 2 filter_data <- function(choose_continent, data = gapminder) { gapminder_continent <- data |> filter(continent == choose_continent) return(gapminder_continent) }In the first version, the
gapminderdata is hard-coded into the function, whereas in the second it is passed in through thedataargument. I suggest using the second for two reasons:This allows you to specify a different data set more easily. For example, if you re-run a report each month with an updated dataset, it’s easier to pass it into the function (rather than having to ensure you load it into R using a specific name).
It means that you are not relying on objects existing in your global environment in order for your function to work. Everything the function needs is passed in as an argument. It makes it more self-contained and easier to re-use in other projects or share with other people.
Setting the default value of
data = gapmindermakes it just as easy to use as the first version. One question was raised about whether is was safe to usedataas an argument name. Given thatdata()is also a function in base R, how safe is it to also create an argument with that name? Especially since we’re often discouraged from creating variables calleddatafor this very reason.One thing to note is how R searches through different environments for the variable you are trying to use. R looks inside the function environment, before it looks in the global environment - so it will always use the
dataargument of the function, before it uses thedata()function that exists in base R. Unless you want to use thedata()function inside your own function, it’s likely to be absolutely fine. If you want to be extra safe, you could use.datainstead ofdata, like many of the {tidyverse} functions do.Can I create parameterized tables instead of plots?
Yes, you can create a parameterized table function in a very similar way to creating a parameterized plot function. There are many packages in R that allow you to create complex (or simple) tables. Your choice of table-making package will likely depend heavily on how complex it is, and what output format you are rendering to. An example of a parameterized table function that uses the
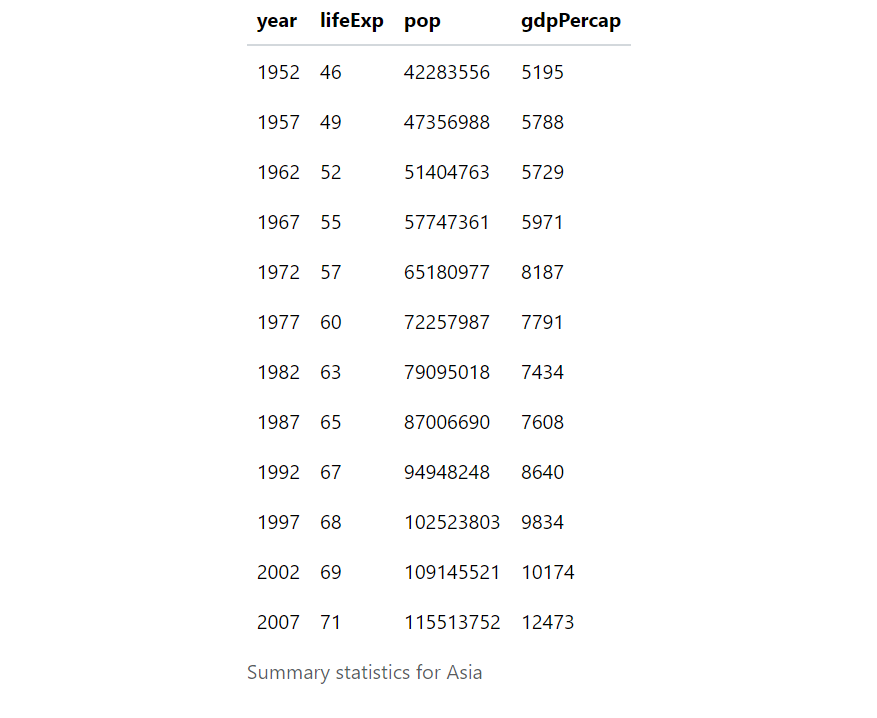
{tinytable}package:library(gapminder) library(tinytable) library(dplyr) library(glue) continent_table <- function(choose_continent, data = gapminder) { data |> filter(continent == choose_continent) |> group_by(year) |> summarise(across(c(lifeExp, pop, gdpPercap), ~round(mean(.x)))) |> tt(caption = glue("Summary statistics for {choose_continent}")) }You can then use the function in your parameterised Quarto document (or elsewhere):
```{r}
continent_table(params$choose_continent)
```
to give:
What’s the difference between
walk()andmap()from the {purrr} package?Both functions take two arguments: the list of elements to map over, and the function that should be applied to each one. The difference is that
map()returns output to the console (that can be saved as a varaible) whereaswalk()is used when we’re calling a function for it’s side effects e.g. rendering a Quarto document.Both functions will work for mapping over different parameters for
quarto_render(), but themap()function will also print an empty list to the console for every parameter value you pass in - which is kind of annoying. Thewalk()function does the same thing, just quietly.
Quarto-related questions
General questions
What’s the difference between Quarto and R Markdown? Which one should I use?
If you’re an R user, you can essentially think of Quarto as the next-generation of R Markdown. Quarto also has support for Python, Julia, and Observable JS which makes it easier to use the same formatting and workflows for projects in different languages. I’ve previously co-written a blog post for Jumping Rivers called I’m an R user: Quarto or R Markdown? which discusses a lot of the pros and cons of both. Note that this blog is now two years old so some statements might be a little bit out of date.
Personally, I now use Quarto for most new projects. It feels more flexible and more user-friendly (some of the hacky solutions to specific tasks in R Markdown are now handled natively in Quarto). However, for my existing R Markdown projects that are already working or finished, I’m in no rush to convert them. R Markdown will continue to be supported - and I’m taking an if it ain’t broke, don’t fix it just for fun approach!
This recently released video from Posit PBC explains the differences between R Markdown and Quarto, specifically thinking about R users.
How do I use parameters in R Markdown documents?
For R code, parameters essentially work exactly the same in both R Markdown and Quarto. You define the parameters and their default values in the document YAML header, and the access them using e.g.
params$year. See the R Markdown Parameters documentation for more information and examples.How do I use external R files in a Quarto document?
If you are using functions across multiple Quarto documents, or if your documents are just starting to get very long, it can be helpful to keep some of your R code in a separate file e.g. called
functions.Rorutils.R. To load these files into your Quarto document, one approach is to use thesource()function. An alternative approach is to use thefile:code block option:```{r} #| file: R/functions.R ```The file path should be relative to where your Quarto document is, and you need to make sure you set
eval: trueeither in the code block, or document-wide.You can also include one Quarto document within another, by using the
{{< include file.qmd >}}. See the Quarto Includes documentation for more information.Can I pass a
data.frameas a parameter?Yes, you can - pass the name of the
data.frameas a parameter and access it usingget(). For example,--- title: "Data as a parameter" params: dataset: "mtcars" --- ```{r} head(get(params$dataset)) ```results in:
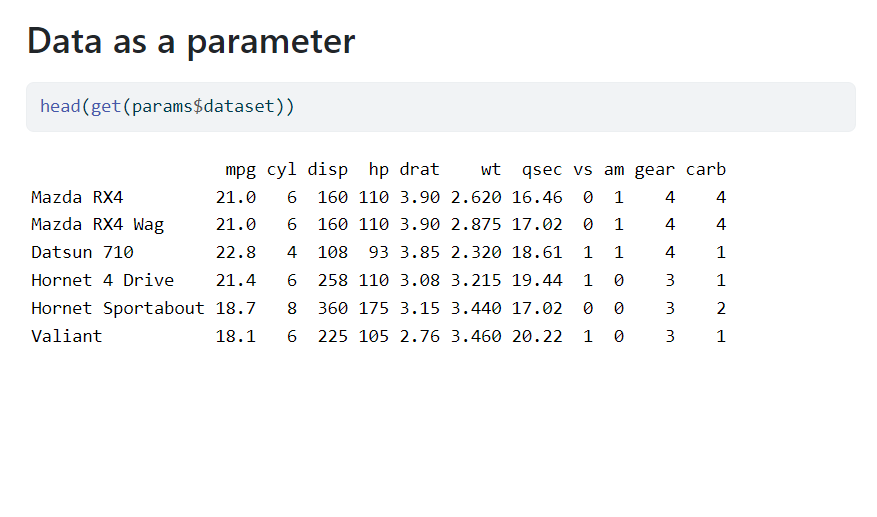
This approach does however feel risky - think about whether there is a better way of setting up the parameters you need e.g. using a CSV file name to load dat for each report instead of relying on a data.frame that already exists somewhere else.
Can I use non-parameter values in the document YAML in my Quarto document?
Yes, you can. You can access e.g. the title, author, or subtitle text using the Quarto meta shortcode. For example, add
{{< meta title >}}to add the title within the text of your Quarto document.There isn’t currently a cross-language way of accessing the document metadata inside a code block, but if you’re an R user, you can access the values using e.g.
rmarkdown::metadata$title.
Styling documents
How do I format my documents?
In the workshop, we didn’t talk much about making your Quarto documents look pretty. And how you make it look pretty, depends a lot on what type of output file you are creating. For PDF output, you can add styling by supplying a LaTeX file of styles, and for HTML output it is added using CSS files. I’d recommend having a look at Quarto extensions. Document styling can be shared via Quarto extensions - so someone may already have implemented the styling you want!
For Word documents, you supply a reference document containing styles for text etc. Word documents are probably the hardest document to implement styling for. The {officeverse} suite of packages offers more flexibility in terms of layout - though this is currently for R Markdown rather than Quarto.
Do Quarto Callout Blocks work in PDF?
Quarto Callout Blocks are coloured text boxes that can be used to highlight a section of a report. Callout blocks should render for HTML, PDF, Word, ePub, and Revealjs outputs. Not all features are available for all formats e.g. collapsible callout blocks won’t work for non-HTML based outputs.
I’ve found that sometimes the styling of callout blocks doesn’t look quite as pretty in Word documents. For output formats that don’t support callout blocks, the content is shown as a block quote element.
You can now create your own custom callout blocks (in addition to the five built-in types) using the Custom Callout Extension For Quarto (currently available for HTML outputs).
Multiple reports
The plots are missing (or only use the last plot) when I render multiple documents using
walk(). How do I fix this?This is a known issue (see GitHub) where the output file name is updated based on the
output_fileargument, but the image names are not. Therefore, they get over-written.A workaround is to set
embed-resources: trueto keep the images contained within the.htmlfile instead of as separate files. Update the YAML of your.qmdfile to add this:--- format: html: embed-resources: true ---Instead of creating 5 different reports for 5 continents, I want all 5 continents in different sections of 1 report. How do I do this?
This is probably a situation where parameterized reports aren’t quite what you’re looking for. Think of parameters as document-wide properties - they’re not something that takes different values within the same document. A better solution would be to make a function that creates the content in your document, and loop over the different values within the document.
If you have a lot of text in your document, and creating that using loops and functions is going to be painful, you could still use parameterized reports - with an extra step to join them together at the end. Instead of generating your document in your desired output format immediately - first generate a series of
.mdfiles (one for each parameter value). The create another Quarto document that uses the Quarto Includes shortcode ({{< include file.qmd >}}) to read in those.mdfiles.Edit: Ken Butler highlighted that you can use the
knitr::knit_expand()to map over a vector of parameters instead of generating.mdfiles. See workflowr.github.io/workflowr/articles/wflow-07-common-code.html for an example.Can I pass in a YAML file instead of passing in values to a list in
quarto_render()?In the command line, you can use
quarto render report.qmd --execute-params params.ymlto pass parameters stored in theparams.ymlfile to Quarto, where theparams.ymlfile looks like this:year: 2002Unfortunately, this doesn’t work:
# THIS DOESN'T WORK! :(
quarto::quarto_render(
  input = "report.qmd",
  execute_params = "params.yml"
)
The
execute_paramsargument inquarto_render()requires a named list rather than a file name. Luckily, theyaml.load_file()function from the {yaml} package can convert a.ymlfile into a named list. This means that the following code does work:quarto::quarto_render( input = "report.qmd", execute_params = yaml::yaml.load_file("params.yml") )I have multiple parameters. How do I loop over all combinations?
Let’s say instead of mapping over just
continentORyear, we want to create a version of our report for every combination ofcontinentandyear. Our Quarto document might have the following parameters in the yAML:params: choose_continent: "Asia" choose_year: 2002Whilst the
walk()function allows us to map over a single input, thewalk2function allows us to map over two inputs:.xand.y. Note that these vectors should be the same length - so we can’ simply pass in the unique values ofyearto.xand the unique values ofcontinentto.y. Let’s first create adata.frameof every combination of the two parameters by usingexpand.grid(). Alternatively, usecrossing()from{tidyr}.gapminder_params <- expand.grid( years = unique(gapminder$year), continents = unique(gapminder$continent) )We then pass each column into the
.xand.yarguments ofwalk2()from{purrr}, remembering to also update theoutput_filename:walk2( .x = gapminder_params$years, .y = gapminder_params$continents, .f = ~quarto_render( input = "example.qmd", output_file = glue("report_{.x}_{.y}.html"), execute_params = list( choose_year = .x, choose_continent = .y ) ) )See the documentation for
walkp()if you have more than two parameters - where a similar approach is used.
Output files
Can I add the date to the file name?
Yes, you can! This is really useful thing to do if you regulary re-run reports - adding the date to the file name easily tells you the last time the report was render. In R, you can get the current date using the
Sys.Date()function. We can edit the input to theglue()function used in theoutput_fileargument to also includeSys.Date():walk( .x = unique(gapminder$continent), .f = ~quarto_render( input = "example.qmd", output_file = glue("report_{.x}_{Sys.Date()}.html"), execute_params = list( choose_continent = .x ) ) )This will result in file names of the form
report_Asia_2024-10-28.html.How can I put the outputs somewhere else?
By default, Quarto outputs the report into the same folder as your
.qmdfile. This is fine when it’s just one report but, if you’re creating perhaps hundreds of parameterized reports, this can quickly become messy. Libby Heeran shared a great tip in the workshop chat of using thefs::file_move()function to move the outputs to a location of your choice.I quite often make use of Quarto projects to control the output location. Quarto projects are most often used to create books or websites, but you can also turn a single Quarto document into a project on its own simply by adding a
_quarto.ymlto the same directory. Add the following to the_quarto.ymlfile:project: output-dir: "Outputs"You don’t need to specify any further information about the project, but now any file in the same directory as the
_quarto.ymlfile, will be rendered to theOutputsfile. Hint: if you’re publishing your document on GitHub Pages (but not using GitHub Actions to render the documents), then settingoutput-dir: "docs"will make for easier set up.
Additional resources
There are many excellent resources available on parameterised plots and documents, and I’ll highlight just a few here. The links to these resources can also be found on the workshop website.
The R for Data Science book has a section on functions which you might find useful if you’re newer to writing your own functions for parameterizing plots or tables.
The Quarto documentation is excellent and has a section on document parameters which includes some examples.
The materials and recording from Cara Thompson’s talk at R/Medicine 2024 are available on her website. She discusseds how to create and refine a parameterised plot function!
Mandy Norrbo wrote a blog post to create parameterised revealjs presentations using Quarto. It also shows you how to create multiple reports for every combination of parameter values that you have.
During the workshop, I talked about combining parameters with conditional content. I previously written a blog post about how I use both to create tutorial worksheets for students.
Keep an eye on the R/Pharma YouTube channel for the recording which will be shared in a few months!
Thank you to the R/Pharma conference team for the invitation to present this workshop, and especially to Phil Bowsher and Libby Heeran (and many others) for your help in answering questions on the day!
Reuse
Citation
@online{rennie2024,
  author = {Rennie, Nicola},
  title = {Parameterized Plots and Reports with {R} and {Quarto}},
  date = {2024-10-28},
  url = {https://nrennie.rbind.io/blog/parameterized-plots-reports-r-quarto/},
  langid = {en}
}