Introducing The Art of Data Visualization with ggplot2
ggplot2, a book of data visualization case studies showing the end-to-end process of building charts, starting from data acquisition to custom styling, entirely in R.
After almost four years of weekly contributions to TidyTuesday (a weekly social data project), I’ve worked with almost 200 datasets and created over 200 data visualizations. Each chapter of the book will look at a different data visualization, covering:
- Data: an introduction to the data set used and how to load it into R. Across the chapters, you’ll see ways of loading data via R packages, local CSV files, APIs, and directly from URLs.
- Exploratory work: exploring the structure of the dataset, identifying issues, and considering potential approaches to visualizaton.
- Preparing a plot: performing the data wrangling needed to make the plot, and creating a first draft using basic
ggplot2functionality. - Advanced styling: editing the basic plot to make it of publication quality with custom styling, including fonts, colors, text, and legends.
- Reflection: some thoughts on how the visualization created in each chapter may be improved, and what aspects of its design are successful.
- Exercises: a few questions for following up on improving the visualizations. These exercises are purposefully left open-ended, rather than prescriptive questions with defined answers. You’re encouraged to think about how you would design and implement different solutions - sharing them on social media is optional!
For each chart, full R code is provided and explained for each step of the creative process.
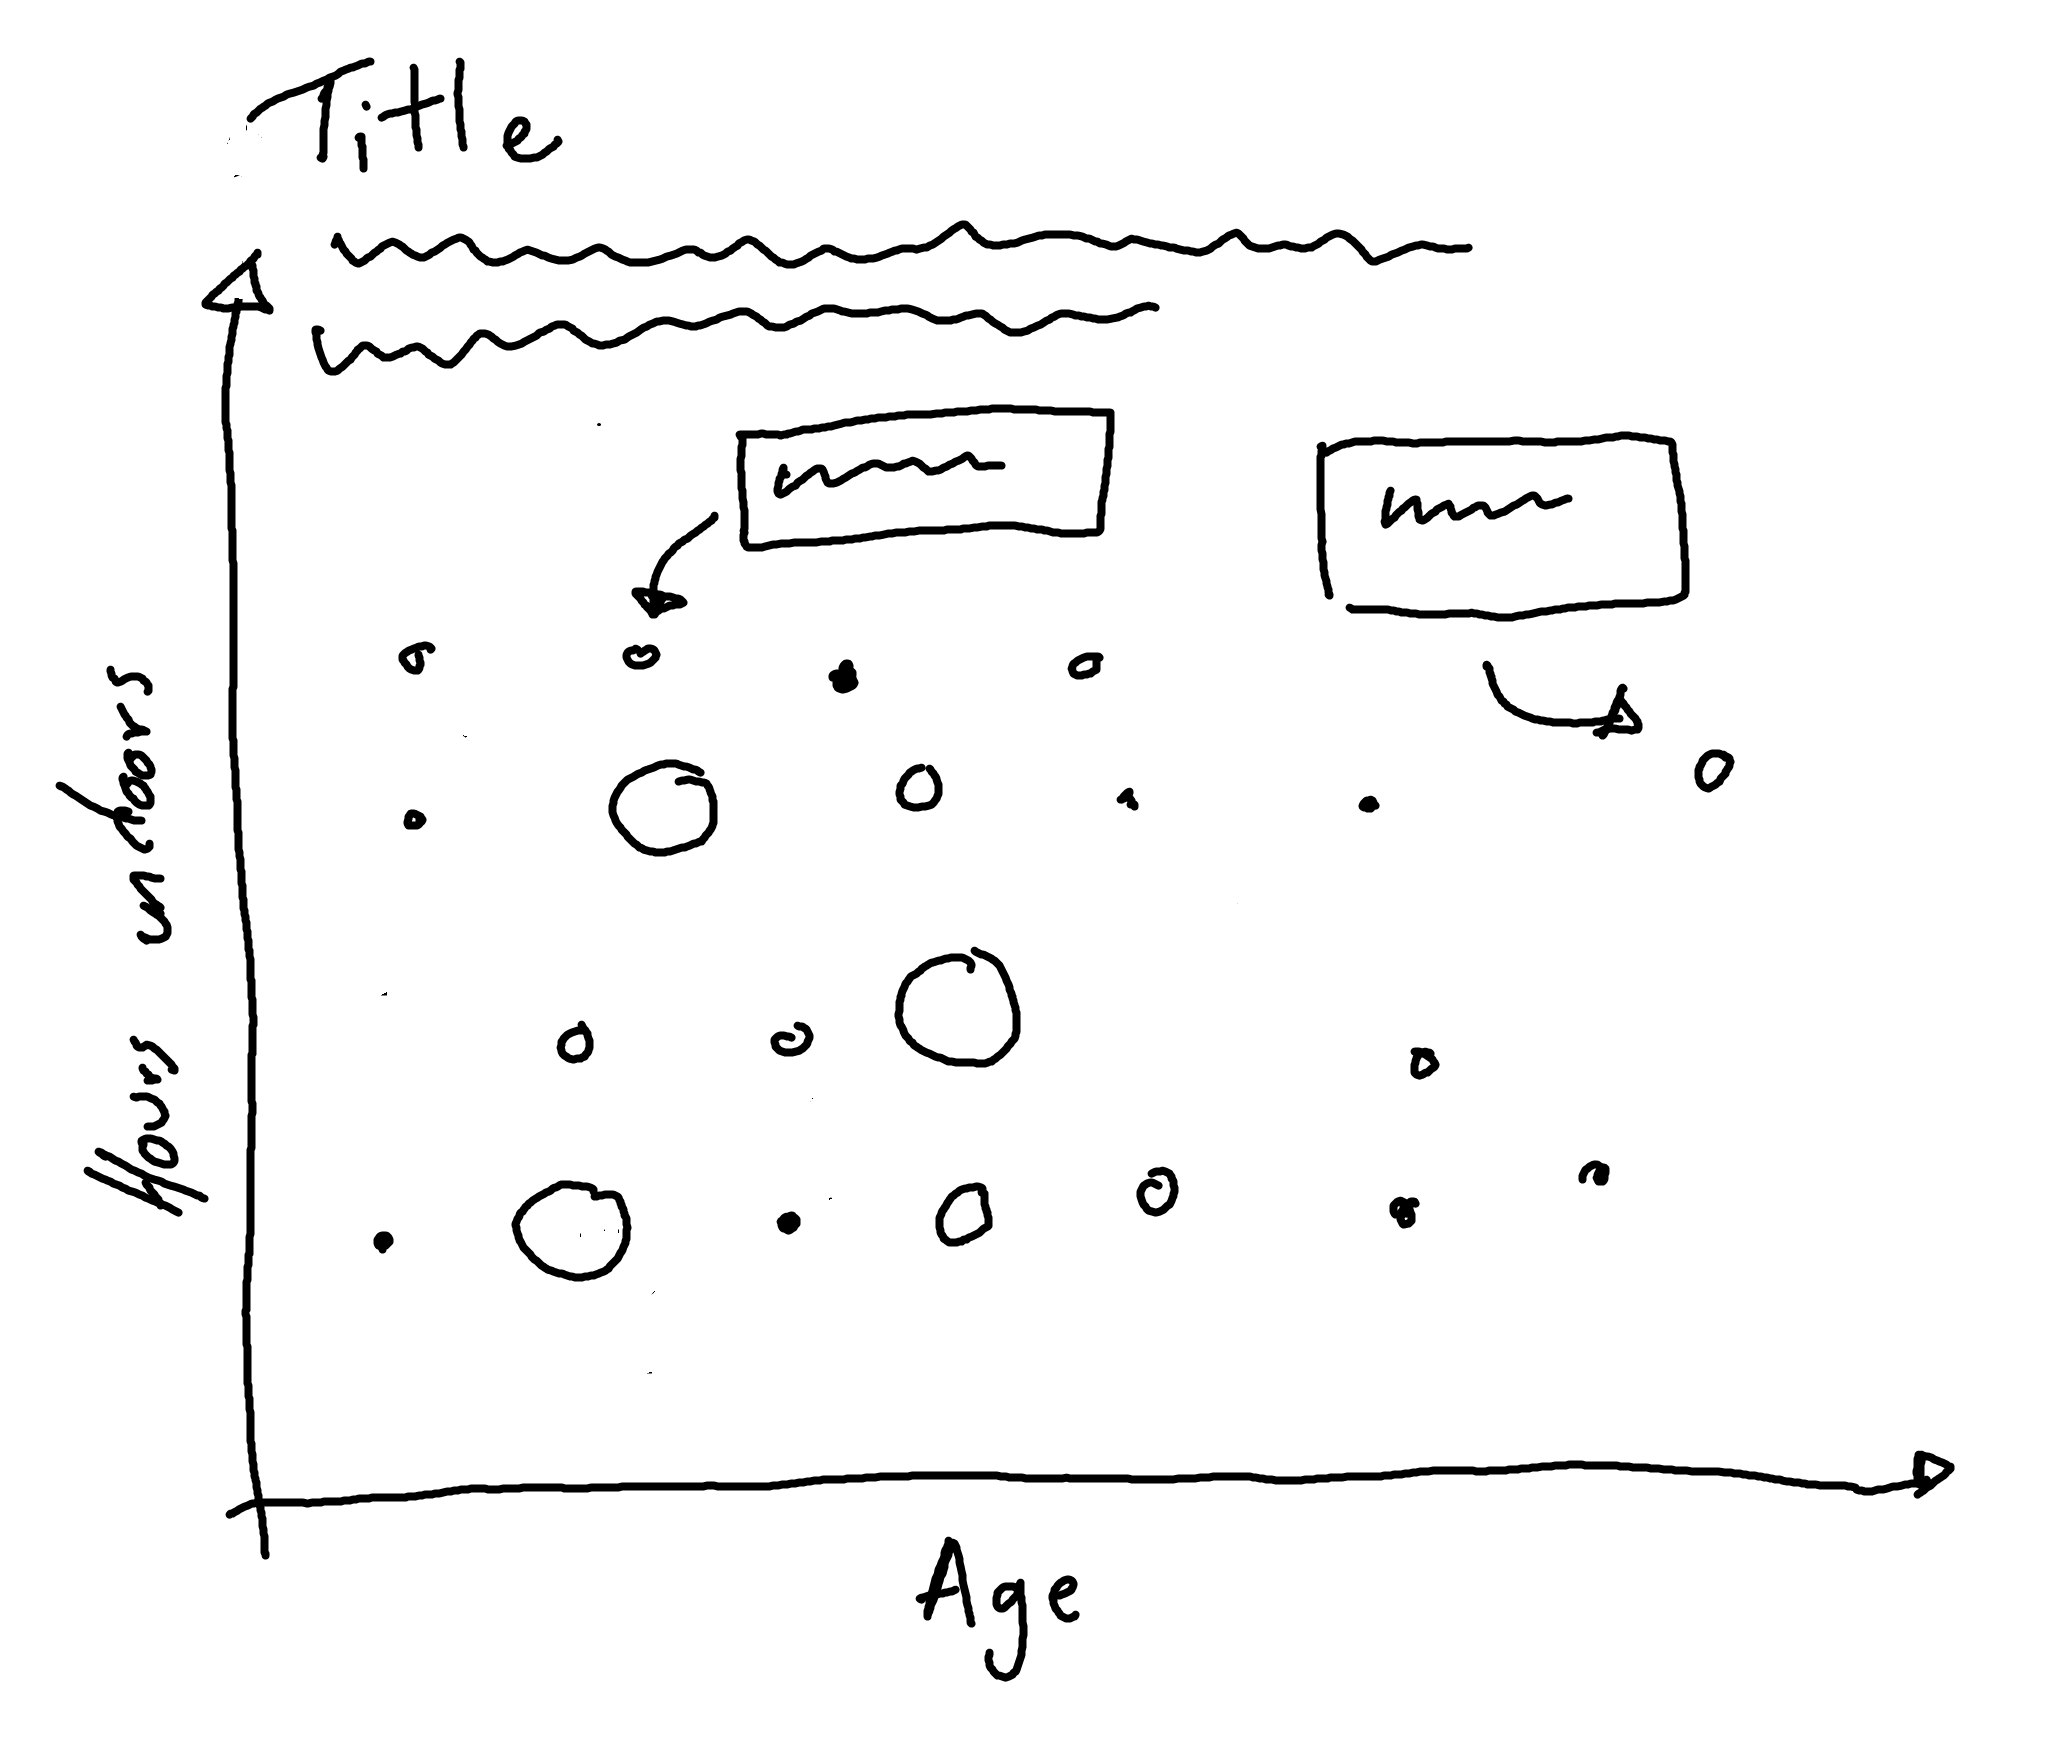
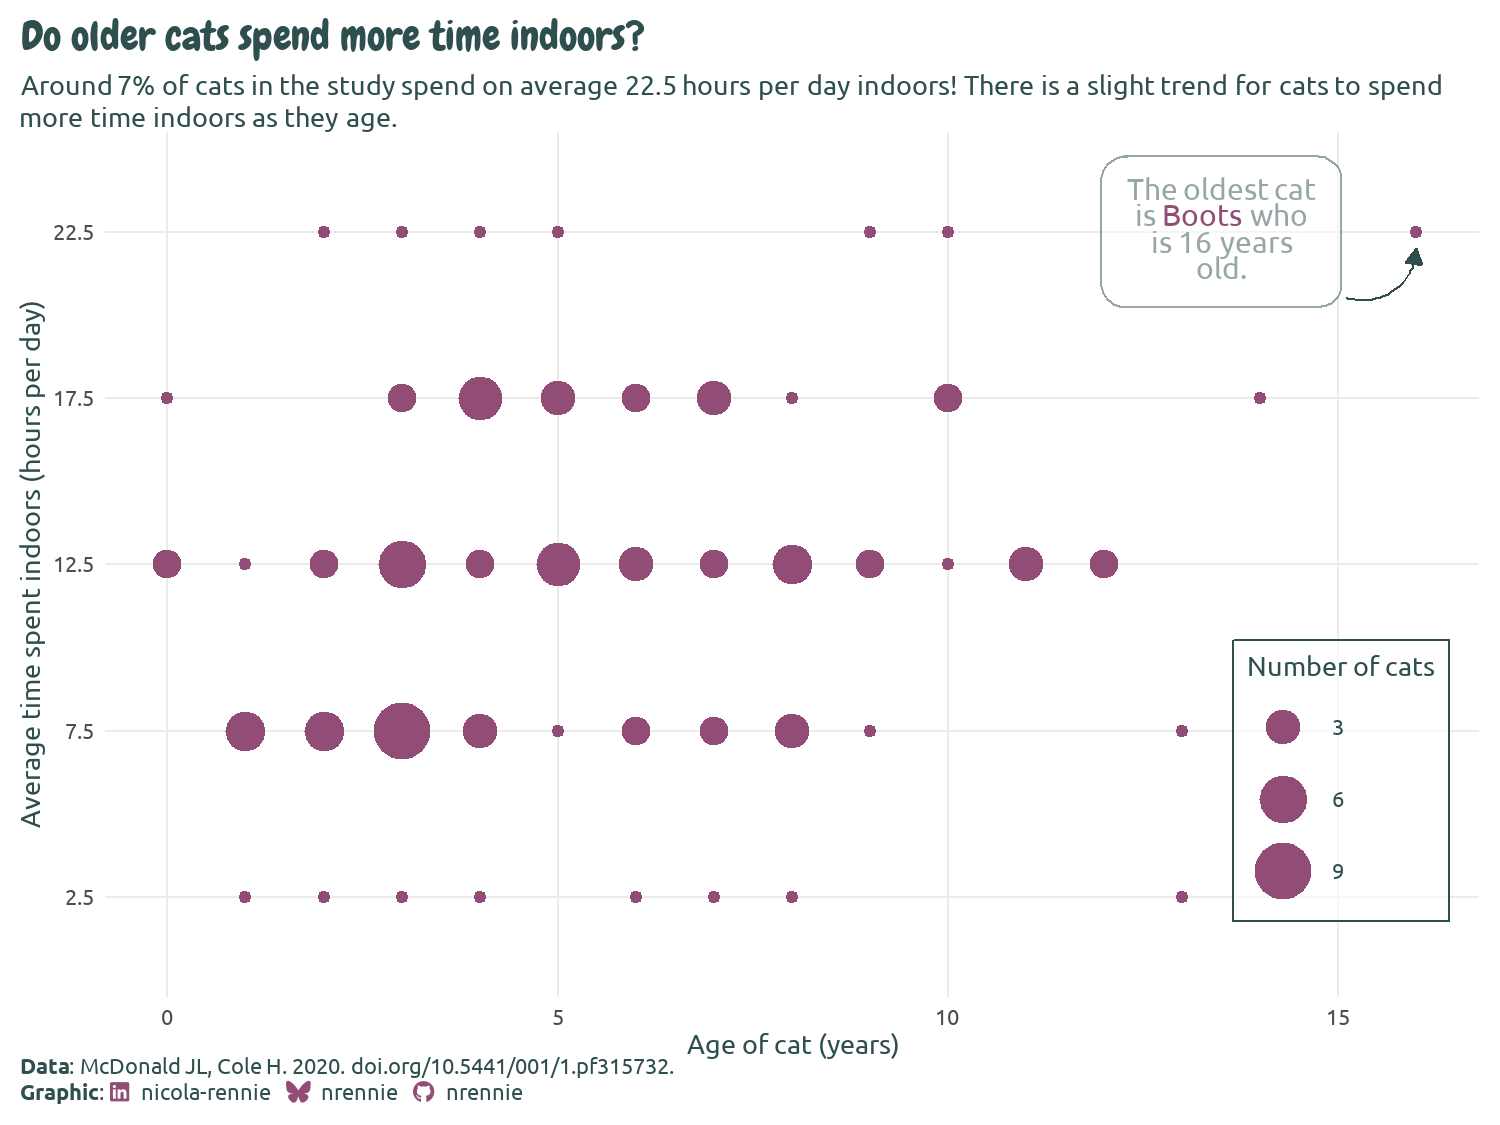
As an example, Chapter 7 uses data about cats to explain the value and technical aspects of adding custom data-driven annotations. We begin by sketching out an idea for chart, then walk through the process of bringing it to life.
The book contains four main sections, each covering a broad aspect of data visualization:
- Common charts don’t need to be boring!: which teaches you how to make classic chart types such as lines charts, and bar charts more effective and more interesting.
- Making use of icons, fonts, and text: where you’ll see different ways to load fonts into R, be able to use icons within charts, and use colored text as an alternative to a traditional legend.
- Working with images: where you’ll see examples of loading and processing images in R, and learn how to add them to plots to create custom labels.
- Visualizing spatial data: where you’ll learn how to manipulate spatial data, create choropleth maps, coordinate plots, and arranging small multiples in a geographic grid.
Frequently asked questions
Where can I read it?
The print version will be published by CRC Press, likely early in 2026. In the meantime, you can read the online version at nrennie.rbind.io/art-of-viz.Can I just see the plots?
The online version of the book features a data visualization gallery where you can browse through the charts created in each chapter.Which R packages do I need to run the code?
The software requirements including R and package versions are listed in the appendix. The list includes all of the packages used to create the entire book, not just the charts, so you don’t need to install all of them! For a specific chart, the packages required are listed and explained at the start of the chapter.
Additional resources
I talked about the process of writing and publishing the book at the Royal Statistical Society conference in September 2025. You can find the slides for that talk at nrennie.rbind.io/talks/rss-conference-book-publishing if you’re interested in the process of how the book came to exist.
None of the work in this book would have existed without TidyTuesday. If you want to improve your data visualization skills, I highly recommend giving it a go and creating some charts! Contributing a dataset is another really good way of developing your programming skills (whether in R, Python, Julia, or something else) and you can find out how by reading the How to Submit a Dataset guidance.
If you only read one part of this book, make it this part of the acknowledgements:
Basically, in short, I’m very grateful for the big, nerdy data community around me.
Because the R, data, and visualization communities are super friendly and a great bunch of people to learn from.
Reuse
Citation
@online{rennie2025,
  author = {Rennie, Nicola},
  title = {Introducing {*The} {Art} of {Data} {Visualization} with
    `Ggplot2`*},
  date = {2025-09-11},
  url = {https://nrennie.rbind.io/blog/art-of-viz-book/},
  langid = {en}
}