What’s new in {PrettyCols} 1.1.0?
Back in September 2022 I submitted {PrettyCols}, an R package containing aesthetically pleasing colour palettes, to CRAN. If you missed it, you can read the blog post introducing the package!
Over a year after the last CRAN release, it was time for an update and this blog post will give you a brief overview of some of the new features and palettes! You can install {PrettyCols} using:
install.packages("PrettyCols")You can also install the development version from GitHub using:
remotes::install_github("nrennie/PrettyCols")The load into R with:
library(PrettyCols)Breaking changes
Previous versions of {PrettyCols} used the name argument in all of the {ggplot2} scale functions to define the name of the palette you wanted to use. Unfortunately, {ggplot2} uses name to define the name of the legend. This meant there was an inconsistency between {PrettyCols} and other {ggplot2} scale functions, and I wanted to fix that in this release. Now, the behaviour is more consistent.
- Change: the
paletteargument is now used to define the name of the colour palette you want to use.
library(ggplot2)
ggplot(
  data = mtcars,
  mapping = aes(x = cyl, fill = as.factor(gear))
) +
  geom_bar() +
  scale_fill_pretty_d(palette = "Peppers")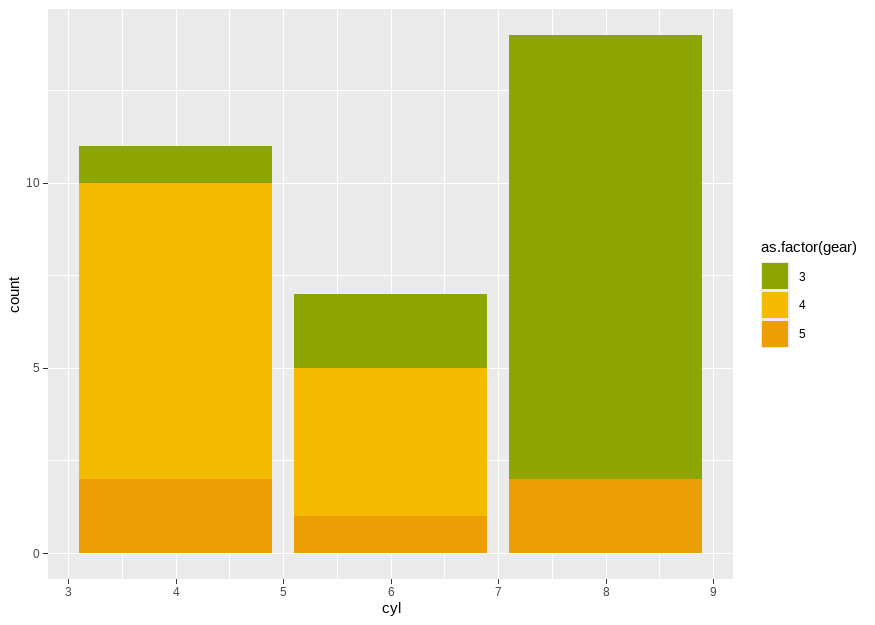
For example, if you have previously scale_fill_manual(name = "Bright") to say you want to use the "Bright" palette, this will result in an error. Please use scale_fill_manual(palette = "Bright") instead. If you didn’t explicitly name the argument for the palette name, your code should still work.
Changing the legend name
To get around the problem above, earlier versions of {PrettyCols} added a legend_title argument to the scale_*_pretty_*() functions. The legend_title argument still works, but you will get a deprecation warning. To maintain consistency with other {ggplot2} scale functions, you should use name instead.
- Change: the
nameargument sets the legend (scale) name.
ggplot(
  data = mtcars,
  mapping = aes(x = mpg, y = disp, colour = wt)
) +
  geom_point(size = 5) +
  scale_colour_pretty_c("Roses", name = "New Title")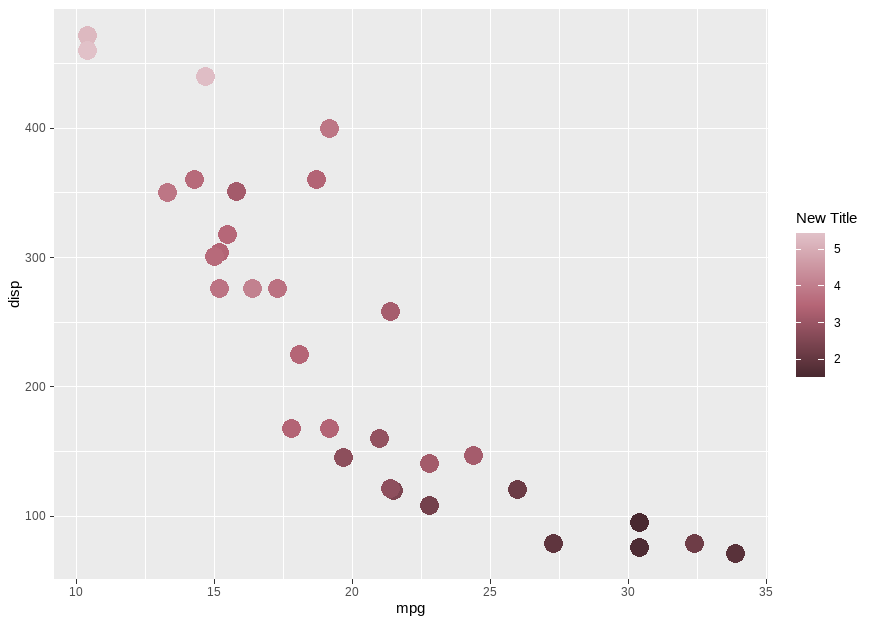
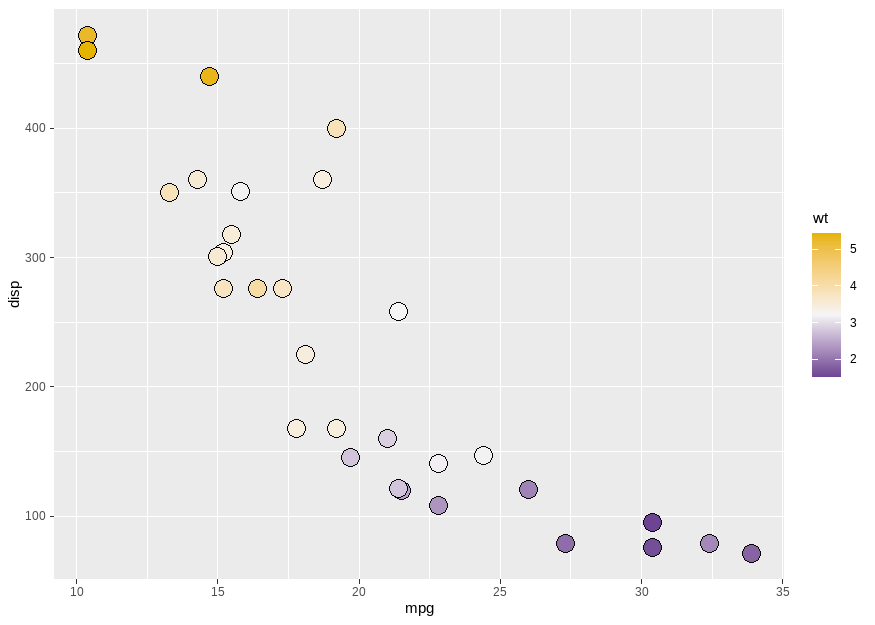
Diverging scales
There were several diverging palettes already within {PrettyCols}, and in version 1.1.0 you can now use the palettes with diverging scales in {ggplot2} more easily.
ggplot(
  data = mtcars,
  mapping = aes(x = mpg, y = disp, fill = wt)
) +
  geom_point(size = 5, pch = 21) +
  scale_fill_pretty_div(
    palette = "PurpleYellows",
    midpoint = mean(mtcars$wt)
  )
The following diverging scales functions now exist:
scale_colour_pretty_div()andscale_color_pretty_div()scale_fill_pretty_div()
They work similarly to scale_*_gradient2().
More palettes!
The new release contains eight additional palettes, taking the total up to 40 palettes! You can see the complete list of available palettes by running view_all_palettes() or browsing the package vignette on available palettes.
Python support
A Python implementation of {PrettyCols} existed in previous releases, but Python support has now moved to a separate GitHub repository. See github.com/nrennie/PrettyPyCols.
To end this post, here’s another couple of examples of these palettes being used for generative art!
Code
aRt::split_grid(
  col_palette = prettycols("Coast"),
  grid_col = prettycols("Coast")[3],
  n_x = 6,
  n_y = 6
)

aRt::window_boxes(
  col_palette = prettycols("Disco"),
  n_x = 20,
  n_y = 20
)

If you find that something in {PrettyCols} isn’t working, or if you’ve got an idea for more features, please raise a GitHub issue!
Reuse
Citation
@online{rennie2024,
  author = {Rennie, Nicola},
  title = {What’s New in {\{PrettyCols\}} 1.1.0?},
  date = {2024-06-20},
  url = {https://nrennie.rbind.io/blog/PrettyCols/PrettyCols-1-1-0/},
  langid = {en}
}