Learning Julia with #TidyTuesday and Tidier.jl
Learning a new programming language can be tricky, and it can sometimes lead to more ways of getting confused - even in languages you know well! I always mix up len() and length()… When returning to Python after primarily working in R for a while, I found Shiny for Python a really good resource for learning. The concepts were similar enough that writing Shiny code in R and Python didn’t feel too different.
I dabbled in Julia during Advent of Code last year, and wanted to learn a little but more. So when I noticed that Karandeep Singh had started developing Tidier.jl - a Julia implementation of the {tidyverse} - I was very keen to give it a go! So I started #JuliaTuesday - where I used the data sets from #TidyTuesday, but performed the data wrangling and visualisation in Julia instead of R. After 10 weeks, I wanted to share what I’d learned.
Since this blog post was written, the Julia implementation of the {tidyverse} has greatly expanded and developed, and so the code in this post may be outdated. See the most recent documentation here.
What is Julia?
Let’s back up a second. What is Julia? Julia is an high-level, general-purpose, open source programming language. One of the main differences between Julia and R is that Julia is a compiled language, whereas R is an interpreted language (as is Python). This means it’s likely to be faster than R, and so it piqued my interest. I’m not going to go into the depths of R versus Julia here - plenty of those blog posts already exist! What I want to talk about is Tidier.jl!
Tidier.jl
Tidier.jl is a Julia implementation of the {tidyverse}. One of its aims is to stick as closely to {tidyverse} syntax as possible - which makes it reasonably straightforward to get started as an R user. In Julia, we can install Tidier.jl using:
using Pkg
Pkg.add("Tidier")
This is essentially equivalent to using install.packages() in R. Before we dive into a full side-by-side comparison of {tidyverse} and Tidier.jl, let’s load some packages and download the data from the #TidyTuesday GitHub repo. Here, I’m using the US Egg Production data, looking at the number of different types of eggs produced each month in the USA.
using Tidier
using UrlDownload
using DataFrames
production = urldownload("https://raw.githubusercontent.com/rfordatascience/tidytuesday/master/data/2023/2023-04-11/egg-production.csv") |> DataFrame ;library(readr)
library(dplyr)
production <- read_csv('https://raw.githubusercontent.com/rfordatascience/tidytuesday/master/data/2023/2023-04-11/egg-production.csv')Though the syntax and function names may be quite different between R and Julia here, you can see that the idea is exactly the same: (i) load packages using Using Pkgname or library(Pkgname), and then (ii) read in the data directly from a URL and save it as a dataframe.
Now let’s see how the two compare on some simple data wrangling tasks. Tidier.jl supports a lot of {tidyverse} functions - primarily those originating in {dplyr} and {tidyr}. See tidierorg.github.io/Tidier.jl/stable/ for full documentation on how these functions work in Tidier.jl.
Let’s filter our data to consider only cage-free organic eggs, and then convert the units to millions of eggs:
plot_data = @chain production begin
  @filter(prod_process == "cage-free (organic)")
  @mutate(n = n_eggs/1000000)
end
plot_data <- production |>
filter(prod_process == "cage-free (organic)") |>
mutate(n = n_eggs/1000000)The key difference here is chaining in Julia. In practice, add an @ before each function, rather than a |>. The other difference here is that we specify when to begin and end the chain, but otherwise - the similarities are striking.
Data visualisation in Julia
There are a lot of different plotting packages in Julia, but the one I found myself using most often was AlgebraOfGraphics.jl. AlgebraOfGraphics.jl a a data visualisation language for Julia, that’s built on the idea of combining different building blocks (using + and *) to make plots. The principles are similar to {ggplot2} - where plots are made of layers. There’s even a theme_ggplot2() function included with AlgebraOfGraphics.jl, if you want to stick with the classic theme.
using AlgebraOfGraphics, CairoMakie
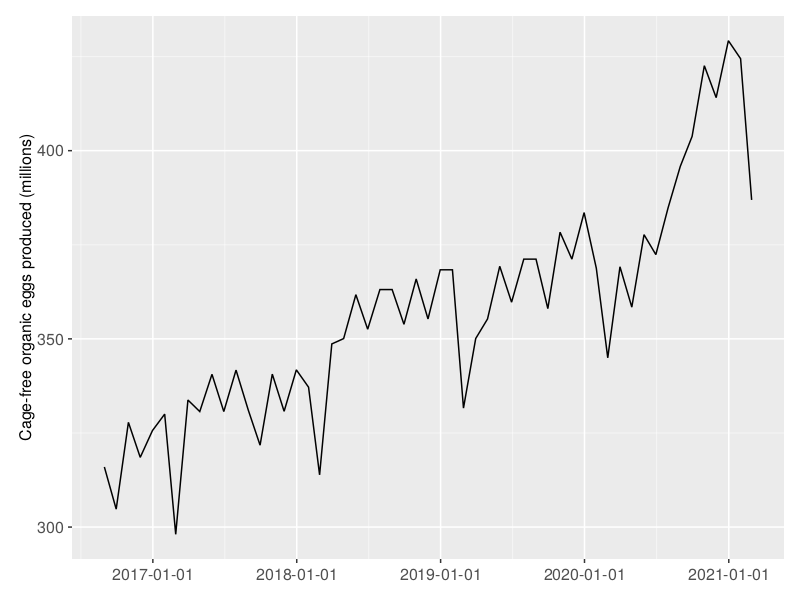
xy = data(plot_data) * mapping(:observed_month, :n) * visual(Lines)
with_theme(theme_ggplot2()) do
draw(xy; axis=(xlabel="", ylabel="Cage-free organic eggs produced (millions)"))
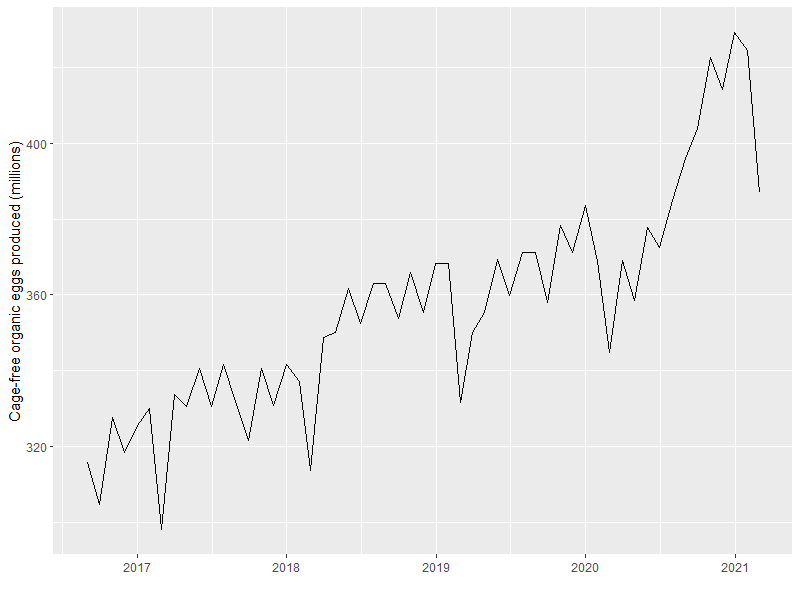
endlibrary(ggplot2)
ggplot(data = plot_data,
mapping = aes(x = observed_month, y = n)) +
geom_line() +
labs(x = "", y = "Cage-free organic eggs produced (millions)")You can see how similar the two plots appear below (the Julia version is on the left!). The only real difference I could spot was that {ggplot2} automatically labels the x-axis with only the year, whereas AlgebraOfGraphics.jl uses the full date.
Another new package has also recently entered the Julia scene - TidierPlots.jl. TidierPlots.jl brings a reimplementation of {ggplot2} to Julia, which is built on top of AlgebraOfGraphics.jl. Although, I didn’t experiment with TidierPlots.jl for my #JuliaTuesday challenge, I couldn’t resist trying it out for this blog post.
At the time of writing, there isn’t yet an implementation of geom_line() in TidierPlots.jl, so we’ll go with points instead:
using TidierPlots
@ggplot(plot_data, aes(x = observed_month, y = n)) +
    @geom_point() +
    @labs(x = "",
          y = "Cage-free organic eggs produced (millions)")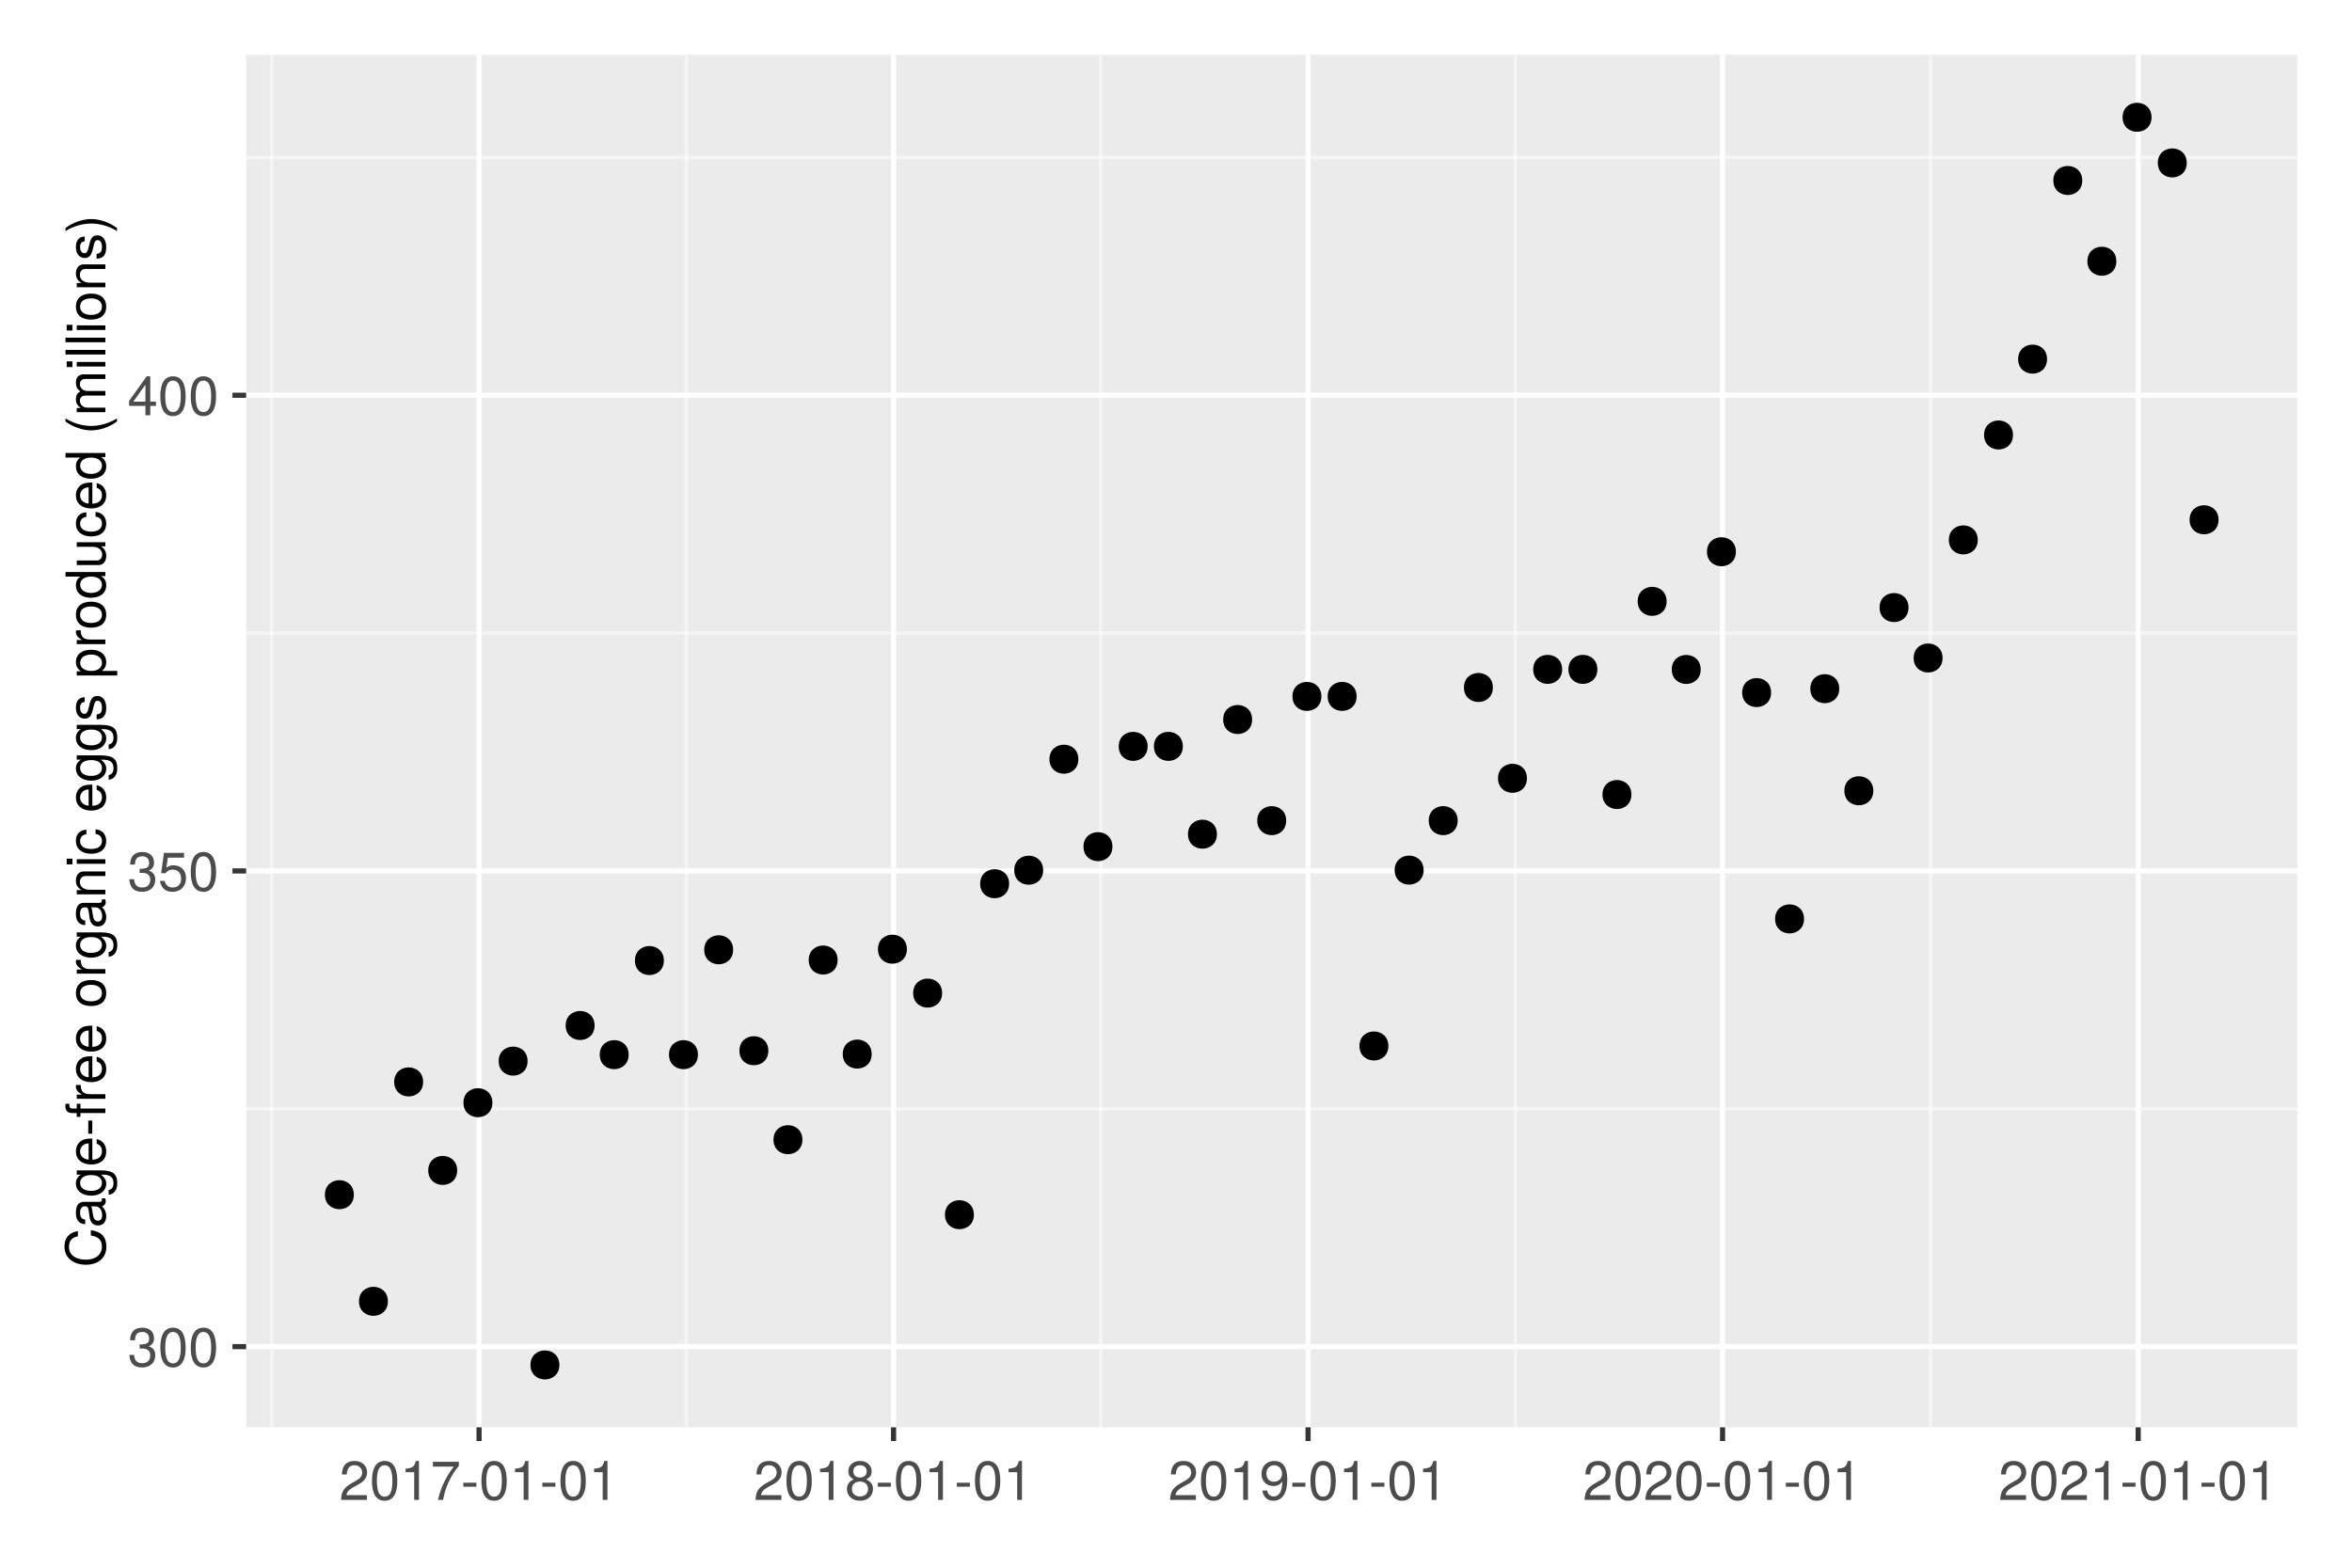
It’s so similar to {ggplot2} that you can almost copy and paste your code - and just add an @ at the start of each line! TidierPlots.jl is one of the most exciting developments in Julia, and if you’re familiar with {ggplot2} (or indeed AlgebraOfGraphics.jl), the learning curve is very, very gentle.
Final thoughts
I really enjoyed getting to grips with Tidier.jl and found it an easier way to start learning Julia, through using concepts and functions that were already familiar to me as an R user. Of course, being proficient in Tidier.jl doesn’t make me proficient in Julia as a whole, but I did get introduced to some of the differences and quirks of Julia along the way. I’m definitely keen to use a little bit more Julia in my work, including with Quarto and in combination with R, through the {JuliaCall} package.
You can view the visualisations I created (with code) in the Quarto document published on QuartoPub. You can also view the source code on GitHub.
Thanks to Karandeep Singh (and other contributors) for developing Tidier.jl - it’s definitely made my Julia journey easier!
Reuse
Citation
@online{rennie2023,
  author = {Rennie, Nicola},
  title = {Learning {Julia} with {\#TidyTuesday} and {Tidier.jl}},
  date = {2023-06-01},
  url = {https://nrennie.rbind.io/blog/learning-julia-with-tidytuesday-tidier/},
  langid = {en}
}