Vortex
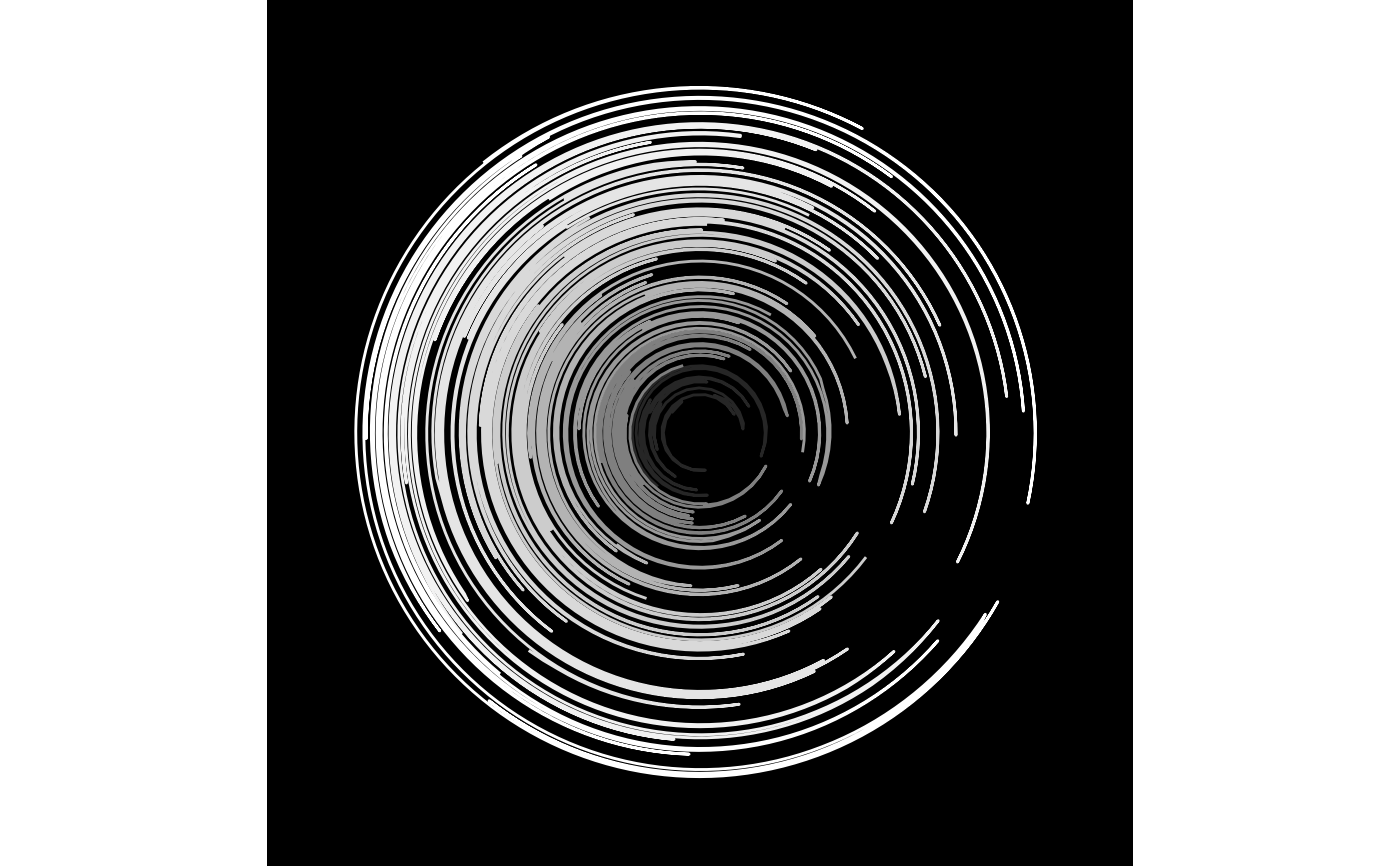
vortex.RdThis function generates a greyscale or rainbow coloured generative art ggplot object shaped like a vortex.
Usage
vortex(
  n = 25,
  start_val = 90,
  col_palette = c("#700460", "#a02c5d", "#ec0f47", "#ee6b3b", "#fbbf54", "#abd96d",
    "#15c286", "#087353", "#045459", "#4b0082"),
  bg_col = "black",
  s = 1234
)
Arguments
- n
Number of points. Default 25.
- start_val
Starting position for polar coordinates. Default 90.
- col_palette
Colour palette. Default
c("#700460", "#a02c5d", "#ec0f47", "#ee6b3b", "#fbbf54", "#abd96d", "#15c286", "#087353", "#045459", "#4b0082").- bg_col
Background colour. Default "black".
- s
Seed value. Default 1234.