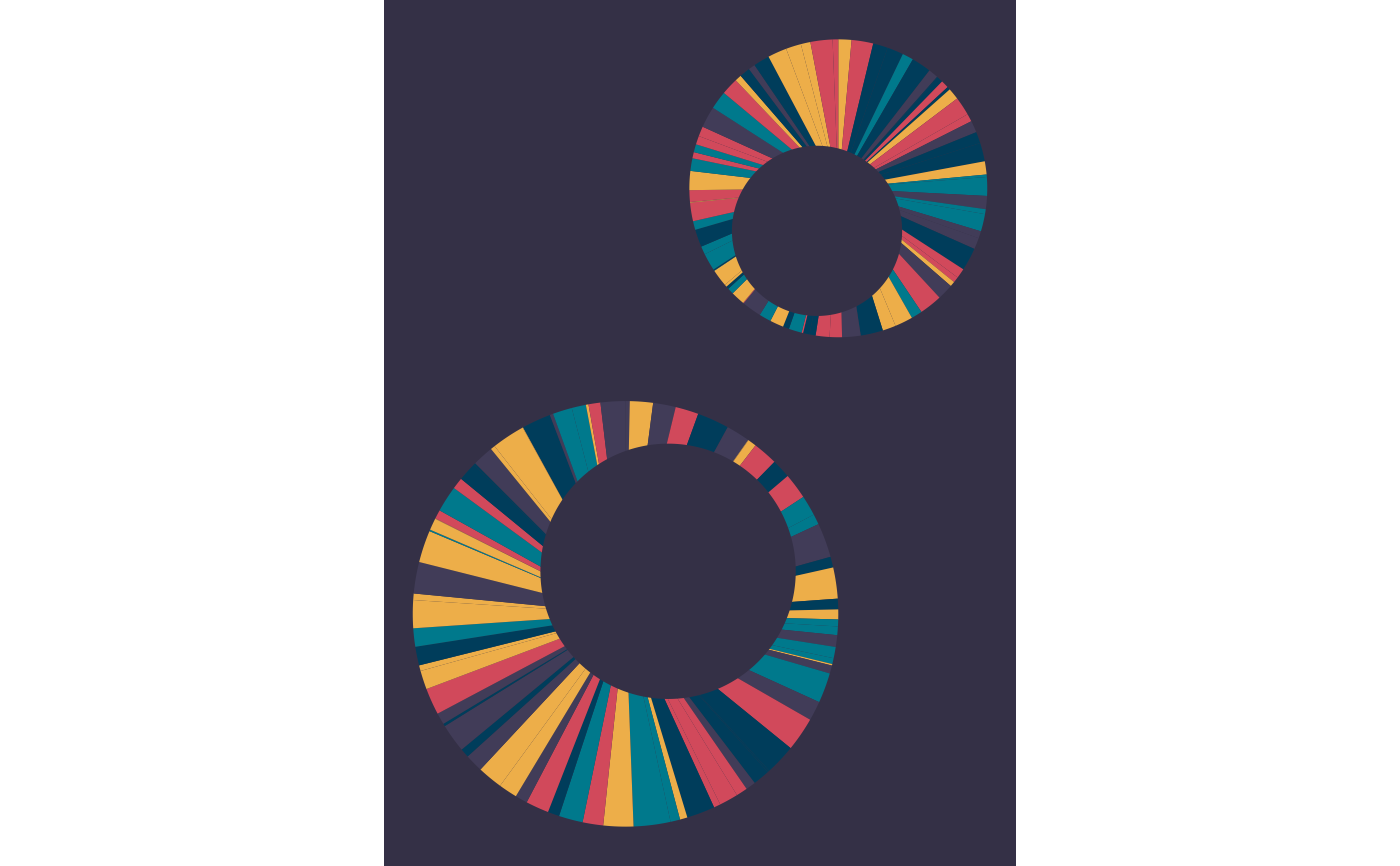
Rings
rings.RdThis function generates a generative art ggplot object using pie charts and circles.
Arguments
- col_palette
Vector of colours. Default
c("#413C58", "#D1495B", "#EDAE49", "#00798C", "#003D5B").- bg_col
Background colour. Default
"#343046".- x_ring
Vector of x-co-ordinates for centre of gaps. Default
c(0.2, 0.9).- y_ring
Vector of y-co-ordinates for centre of gaps. Default
c(0.2, 1.8).- r_ring
Vector of radii for centre of gaps. Default
c(0.6, 0.4).- x0
Vector of x-co-ordinates for pie charts. Default
c(0, 1).- y0
Vector of y-co-ordinates for pie charts. Default
c(0, 2).- r
Vector of radii for pie charts. Default
c(1, 0.7).- n
Vector of slices per pie chart. Default
c(80, 80).- s
Seed value. Default 1234.