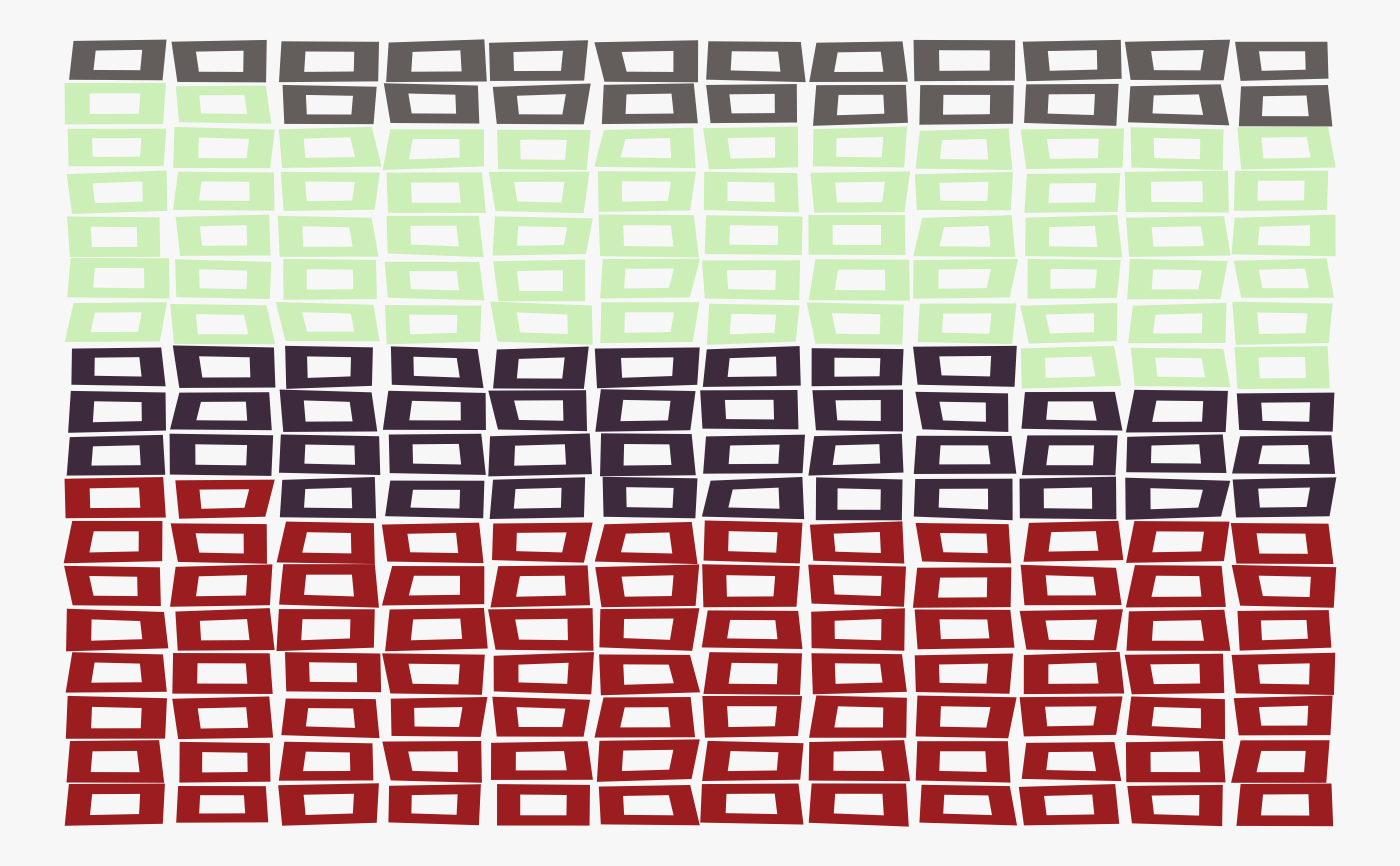
Polygons
polygons.RdThis function generates a coloured generative art ggplot object using polygons.
Usage
polygons(
  n_x = 16,
  n_y = 16,
  gap_size = 0.5,
  deg_jitter = 0.2,
  col_palette = c("#ff9062", "#fd6598", "#cb64c0", "#3294dd", "#75fb8a", "#d0eb60"),
  random = TRUE,
  bg_col = "black",
  s = 1234
)
Arguments
- n_x
Number of polygons per row. Default 12.
- n_y
Number of polygons per column. Default 18.
- gap_size
Numeric between 0 and 1 specifying the size of the gap in the polygons. Default 0.5.
- deg_jitter
Numeric between 0 and 0.5 specifying the degree of jitter. Default 0.2.
- col_palette
Vector of colours. Can be any length. Default
c("#ff9062", "#fd6598", "#cb64c0", "#3294dd", "#75fb8a", "#d0eb60").- random
Boolean for whether colours should be random or ordered. Default TRUE.
- bg_col
Background colour. Default "black".
- s
Seed value. Default 1234.