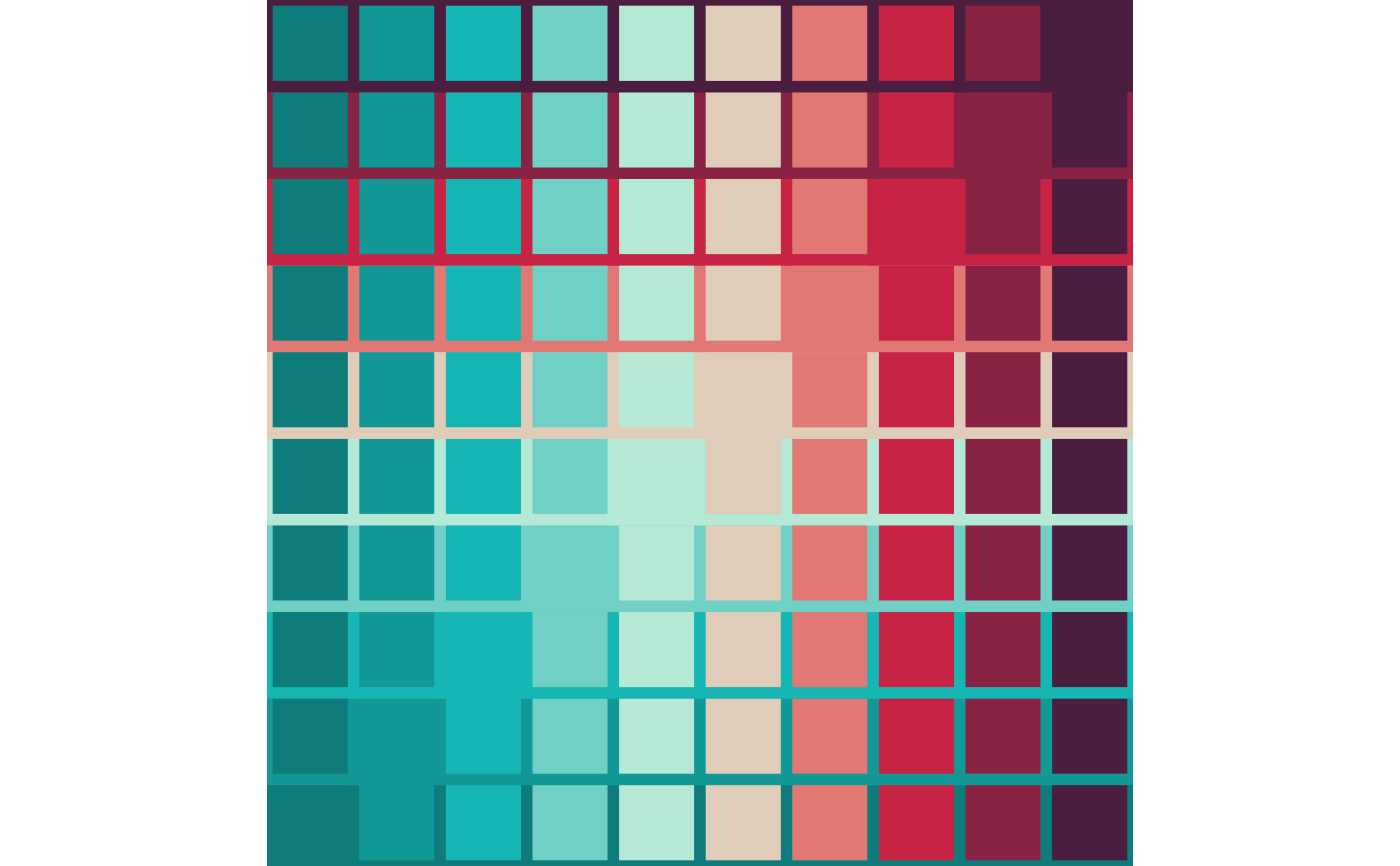
Mesh
mesh.RdThis function generates a coloured generative art ggplot object using rectangles.
Usage
mesh(
  n_x = 10,
  n_y = 10,
  col_palette = c("#0e7c7b", "#17bebb", "#d4f4dd", "#d62246", "#4b1d3f"),
  linewidth = 2,
  rayshade = FALSE
)
Arguments
- n_x
Number of squares per row. Default 10.
- n_y
Number of squares per column. Default 10.
- col_palette
Vector of colours. Default
c("#0e7c7b", "#17bebb", "#d4f4dd", "#d62246", "#4b1d3f").- linewidth
Width of borders around squares. Default 2.
- rayshade
Boolean determining whether the returned plot should be converted to three dimensional using rayshader. If
TRUE,{rayshader}is required to be installed. DefaultFALSE.