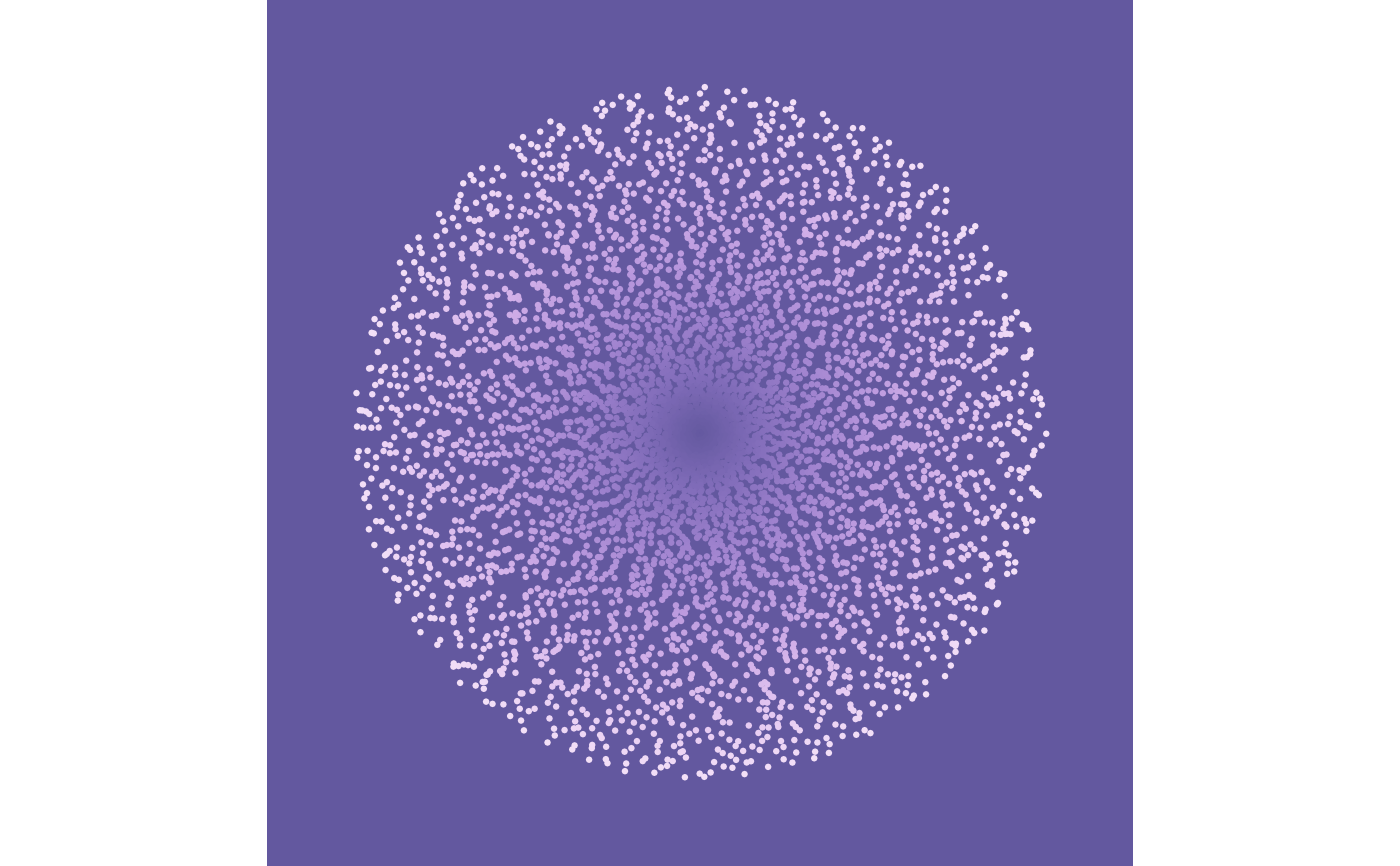
Dots
dots.RdThis function generates a coloured generative art ggplot object using polar coordinates.
Usage
dots(
  n_x = 50,
  n_y = 100,
  jitter_size_width = 0.5,
  jitter_size_height = 0.5,
  col_palette = rcartocolor::carto_pal(n = 7, "Purp"),
  bg_col = "#63589f",
  s = 1234
)
Arguments
- n_x
Number of rotational points. Default 50.
- n_y
Number of outwards points. Default 100.
- jitter_size_width
Size of jitter width. Default 0.5.
- jitter_size_height
Size of jitter height. Default 0.5.
- col_palette
Vector of colours. Default
"Purp"colour palette from rcartocolor.- bg_col
Background colour. Default
"#63589f".- s
Seed value. Default 1234.
