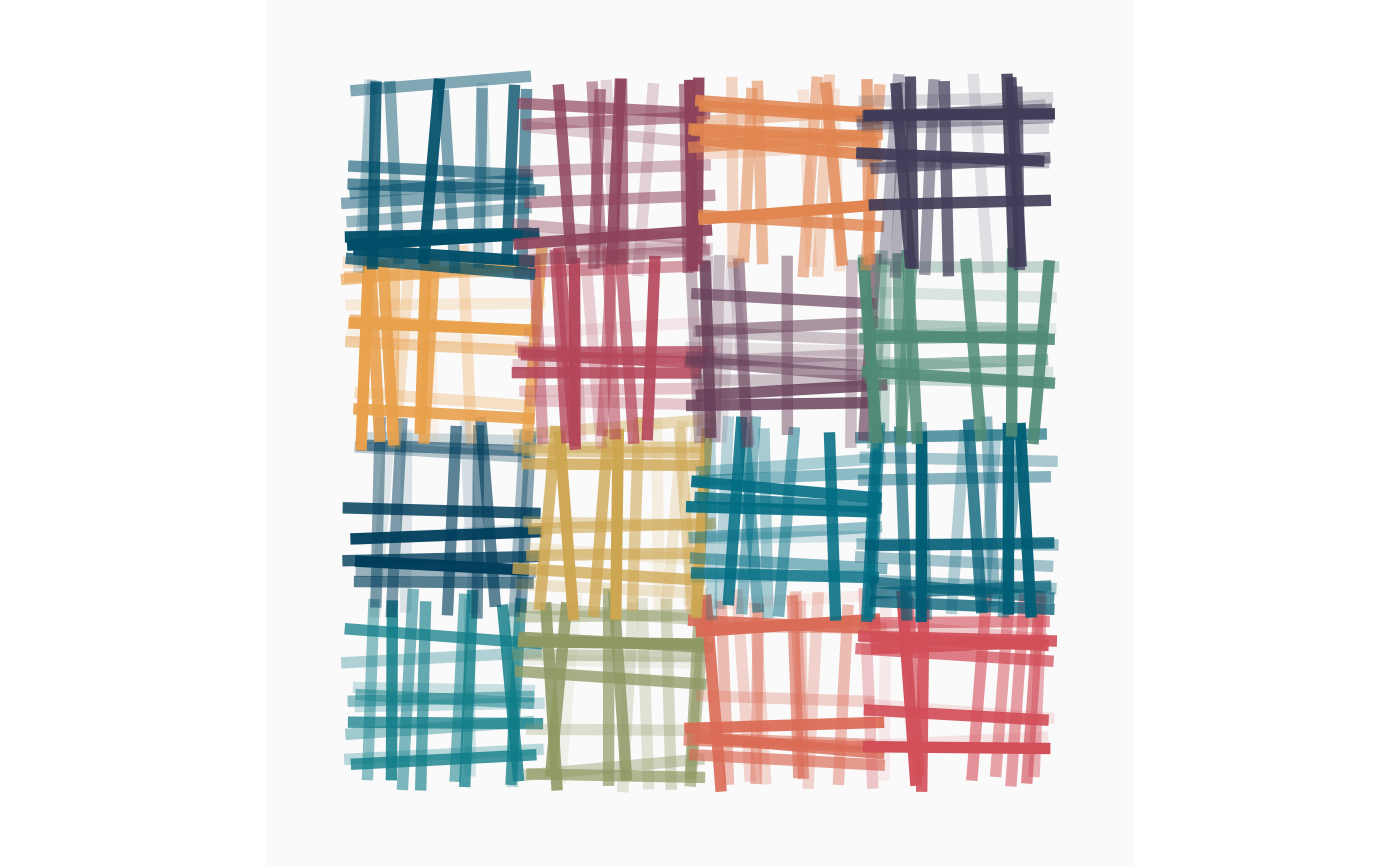
Crosshatch
crosshatch.RdThis function generates a coloured generative art ggplot object using overlapping lines in a grid.
Usage
crosshatch(
  n_x = 4,
  n_y = 4,
  n_lines = 10,
  line_overlap = 0.1,
  line_slope = 0.1,
  linewidth = 2,
  col_palette = c("#413C58", "#D1495B", "#EDAE49", "#00798C", "#003D5B"),
  bg_col = "#fafafa",
  interpolate = TRUE,
  s = 1234
)
Arguments
- n_x
Number of columns in grid. Default 4.
- n_y
Number of rows in grid. Default 4.
- n_lines
Number of lines per grid square. Default 10.
- line_overlap
Line overlap outside grid. Default 0.1.
- line_slope
Line slope within grid. Default 0.1.
- linewidth
Thickness of lines. Default 2.
- col_palette
Vector of colours. Default
c("#6497b1", "#6a359c", "#FFB04F", "#679c35", "#cd1076").- bg_col
Background colour. Default
"gray10".- interpolate
Boolean indicating if colours should be interpolated. Default TRUE.
- s
Seed value. Default 1234.
