Chaos
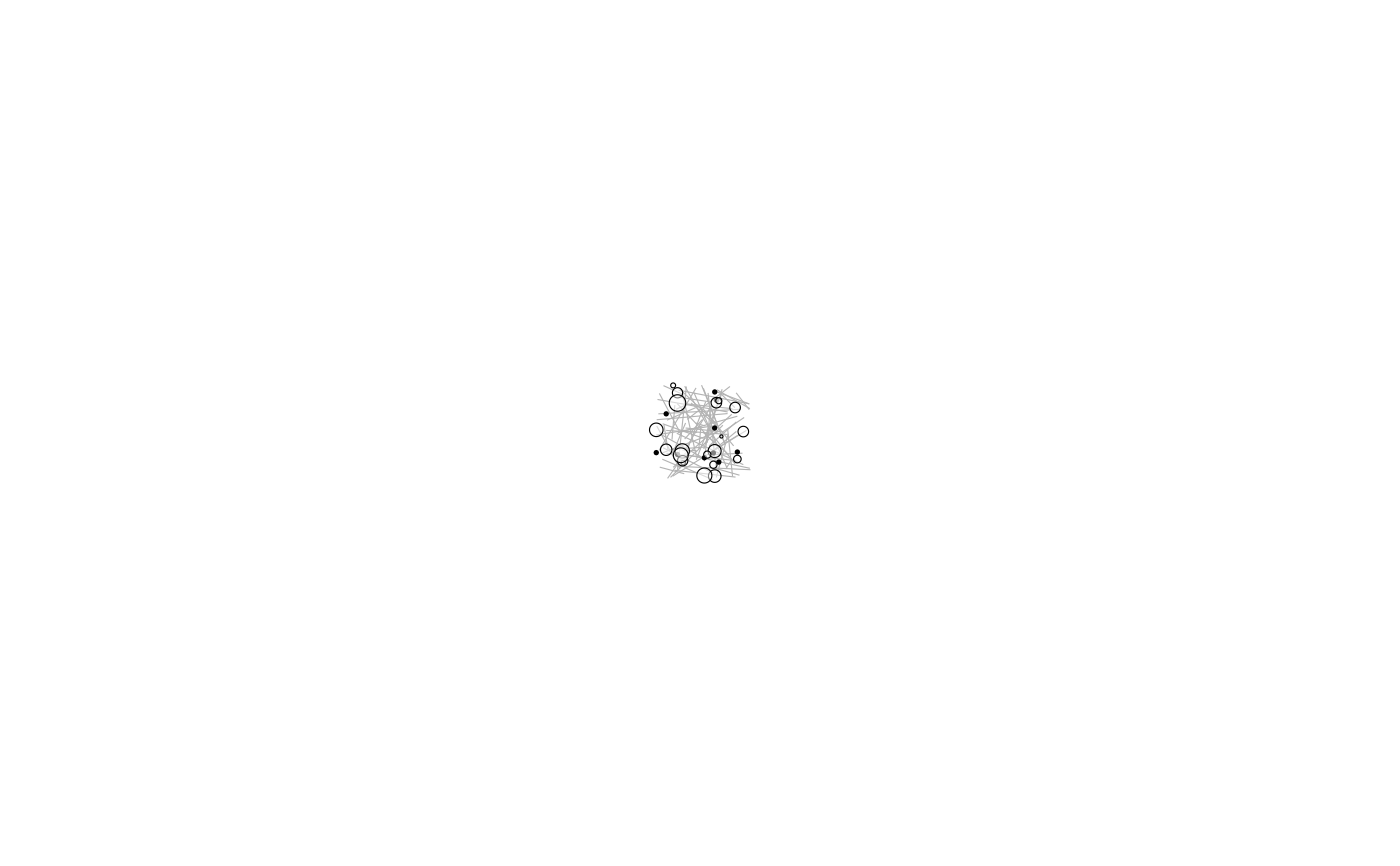
chaos.RdThis function generates a generative art ggplot object using a lines, points, and circles.
Usage
chaos(
  n_lines = 75,
  n_points = 10,
  n_circles = 20,
  line_col = "grey70",
  point_col = "black",
  circle_col = "white",
  circle_line_col = "black",
  bg_col = "white",
  min_circle = 0.01,
  max_circle = 0.1,
  linewidth = 0.2,
  alpha = 0.5,
  size = 0.3,
  s = 1234
)
Arguments
- n_lines
Number of lines. Default 75.
- n_points
Number of points. Default 10.
- n_circles
Number of circles. Default 20.
- line_col
Line colour. Default "grey70".
- point_col
Point colour. Default "black".
- circle_col
Circle fill colour. Default "white".
- circle_line_col
Circle line colour. Default "black".
- bg_col
Background colour. Default "white".
- min_circle
Minimum circle radius. Default 0.01.
- max_circle
Maximum circle radius. Default 0.1.
- linewidth
Linewidth of lines and circles. Default 0.2.
- alpha
Transparency of circles. Default 0.5.
- size
Size of points. Default 0.3.
- s
Seed value. Default 1234.
