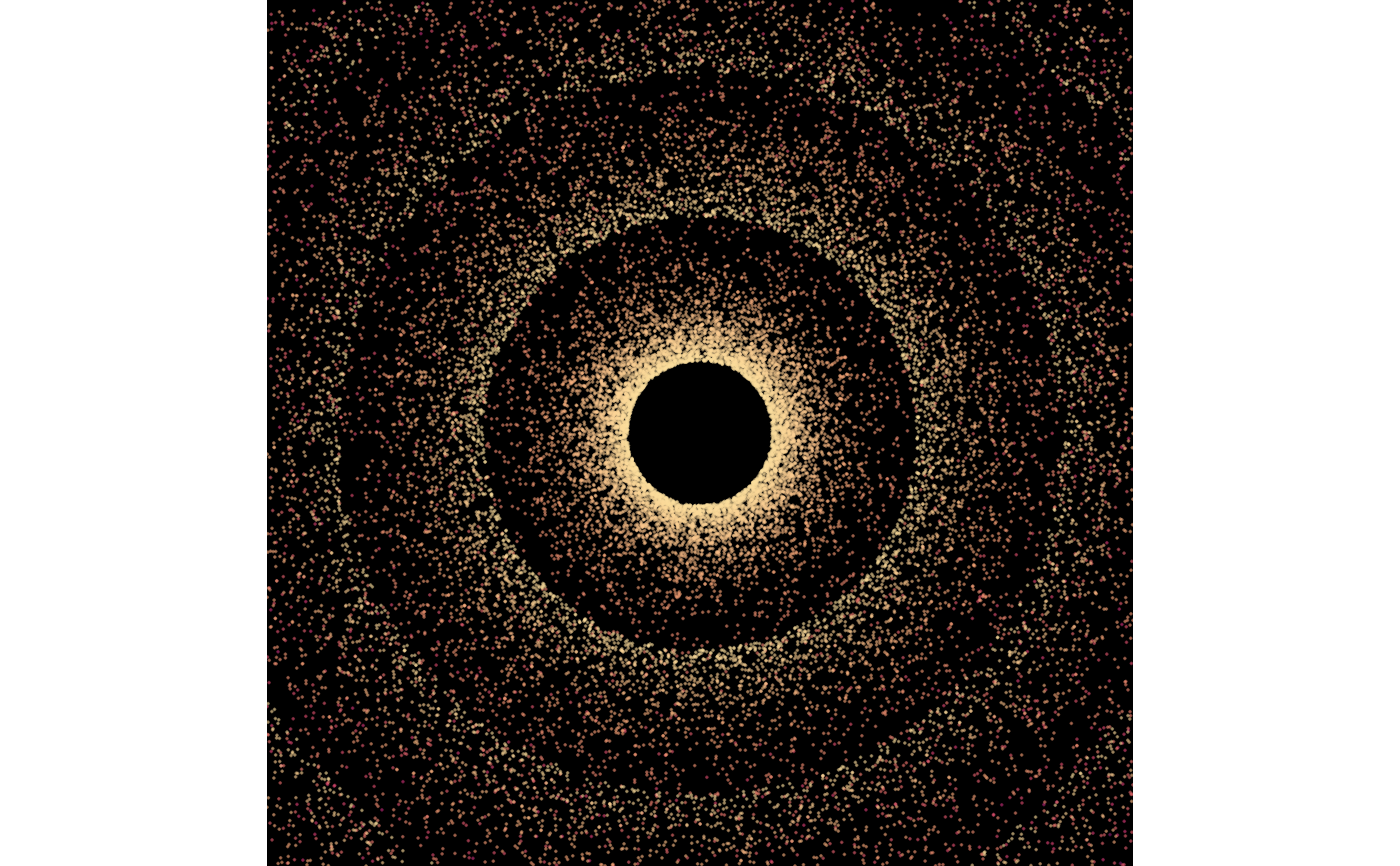
Black Hole
black_hole.RdThis function generates a generative art ggplot object using points.
Arguments
- r_max
Vector of radii for the internal circle. Default
c(50, 150, 250, 350).- n
Number of points per circle. Default 10000.
- lim
Numeric specifying size of grid. Default 400.
- main_cols
Vector of colours (or single colour). Default
rcartocolor::carto_pal(n = 7, name = "SunsetDark").- bg_col
Background colour. Default "black".
- size
Size of points. Default 0.01.
- a
Transparency of points. Default 0.5.
- s
Random seed. Default 1234.
