How good is your country at statistics?
Explore Statistical Performance Indicators from the World Bank
National statistical systems face major pressure from rising expectations for high-quality, reliable data to support decisions. This pressure is heightened by the rapidly evolving demands and technologies that shape how data is produced and used. The World Bank has developed Statistical Performance Indicators (SPI) to monitor the statistical performance of countries.
- In 2024, Norway, Sweden, and Canada scored highest overall, whilst South Sudan, Turkmenistan, and Equatorial Guinea scored lowest overall.
- Tajikistan saw the largest improvement in score, gaining 10.3 points.
- In contrast, Slovak Republic dropped 6.5 points.
What is a Statistical Performance Indicator?
The SPI are composed of more than 50 indicators which can be combined to give an overall score between 0 and 100. A score of 0 means very poor statistical performance, and a score of 100 means excellent statistical performance.
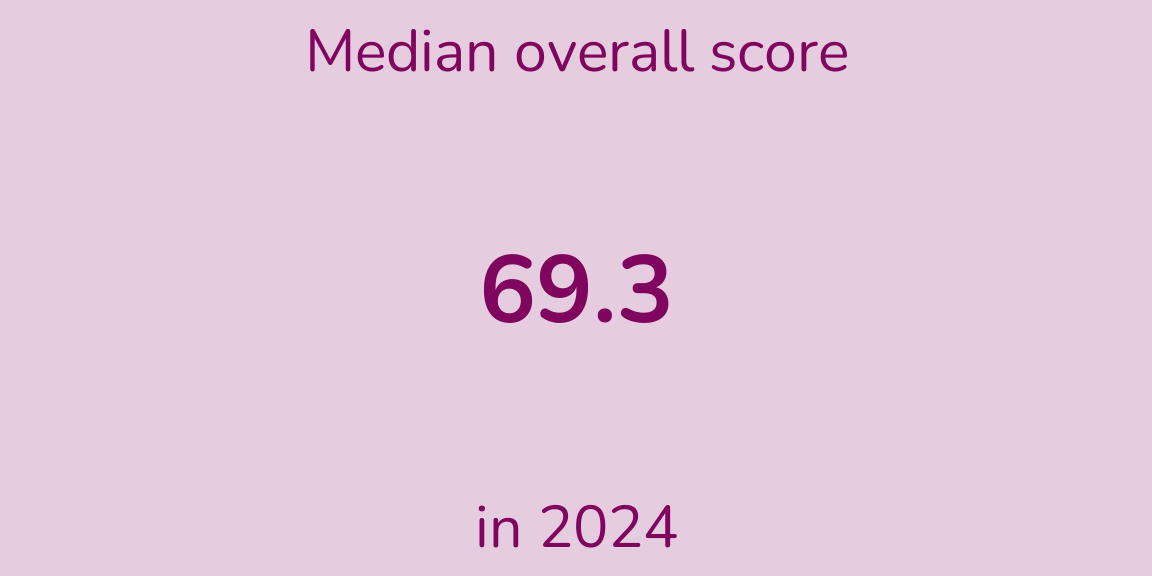
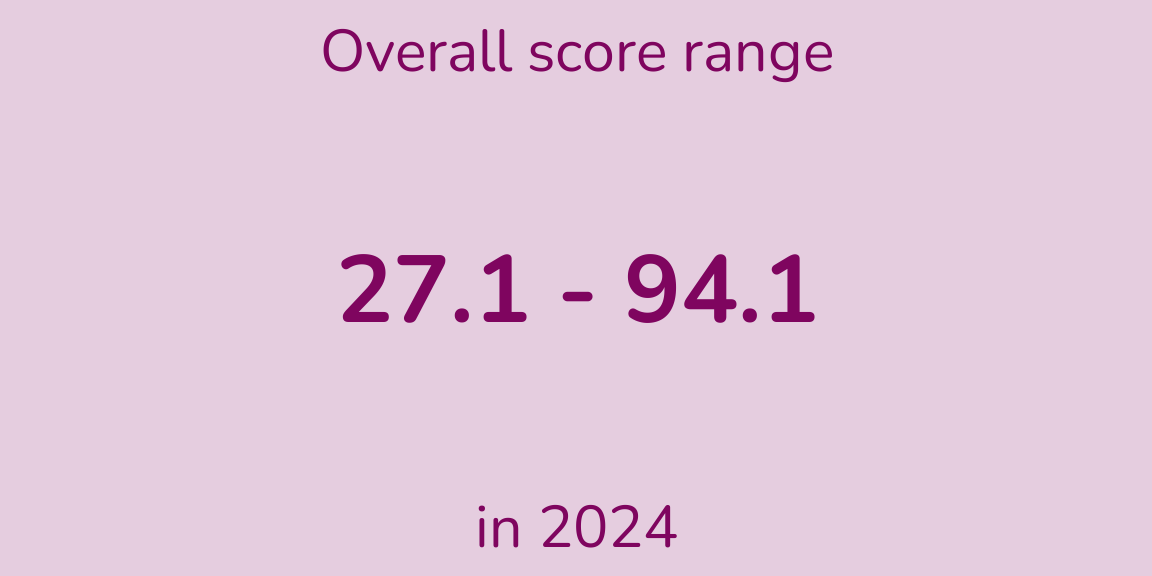
Many countries have a score above 90, representing good statistical performance. Only one country (South Sudan) had a score of below 30 in 2024.
The indicators used to compute the overall score cover five key pillars a country’s statistical performance: data use, data services, data products, data sources, and data infrastructure.
Statistical performance is improving
SPI data extend from 2016 to 2024, with some indicators going back to 2004 though not all countries have data available across all pillars for all years. On average, performance has steadily increased between 2016 and 2024 with most individual countries showing a similar pattern.
Statistical performance across the globe
The SPI contain data for 186 countries, which covers 99 percent of the world population.
Comparing countries in the same region
There are differences in statistical performance across different World Bank geographic regions, with some regions showing more variability than others.
Comparing countries with similar income
The World Bank classifies countries into the following income groups based on their Gross National Income (GNI, the total income earned by a country’s residents and businesses):
- High income: GNI per capita above US $13,935
- Upper middle income: GNI per capita between US $4,496 and $13,935
- Lower middle income: GNI per capita between US $1,136 and $4,495
- Low income: those with a GNI per capita of US $1,135 or less
Statistical performance tends to be lower in countries with lower GNI, and higher in countries with a higher GNI. However, performance is rising across all income groups on average.
Comparing countries with similar populations
On average, countries with a larger population have a slightly higher overall statistical performance score. However, this difference is very small. Although more highly populated countries may have more resources, there is increased complexity and cost in measuring very large populations.
Overall SPI offer a structured way to assess how well a country’s statistical system is performing, allowing comparisons to be made over time and between different countries. Statistical performance is improving in made places. However significant differences exist between countries, especially between those who have high and low incomes.
Cite this work
For attribution, please cite this work as:
Rennie, Nicola. 2025. “How good is your country at statistics?” December 2, 2025. nrennie.rbind.io/statistical-performance-indicators.
BibTeX citation:
@online{rennie2025,
author = {Rennie, Nicola},
title = {How good is your country at statistics?},
date = {2025-12-02},
url = {https://nrennie.rbind.io/statistical-performance-indicators/},
langid = {en}
}