Beyond the basics of literate programming
Data visualisation specialist, mainly using R, Python, and D3.
Background in statistics, operational research, and data science.
Author of several R packages (mainly for visualisation).
Co-author of Royal Statistical Society’s Best Practices for Data Visualisation guidance.
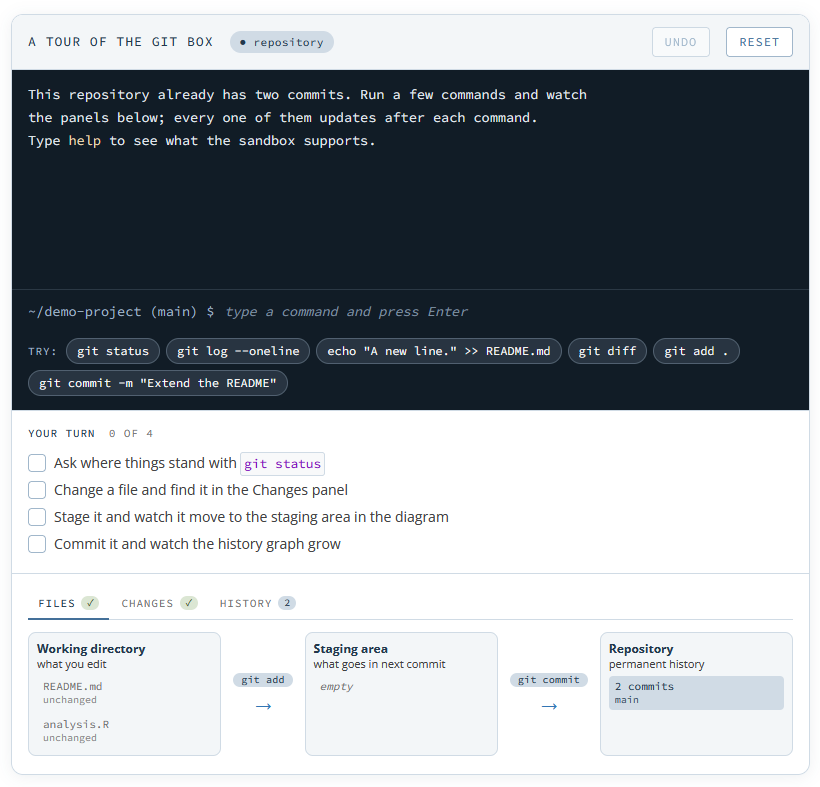
git-sandbox block in your Quarto document becomes a real Git repository running in a browser
{ojs} code blocks---
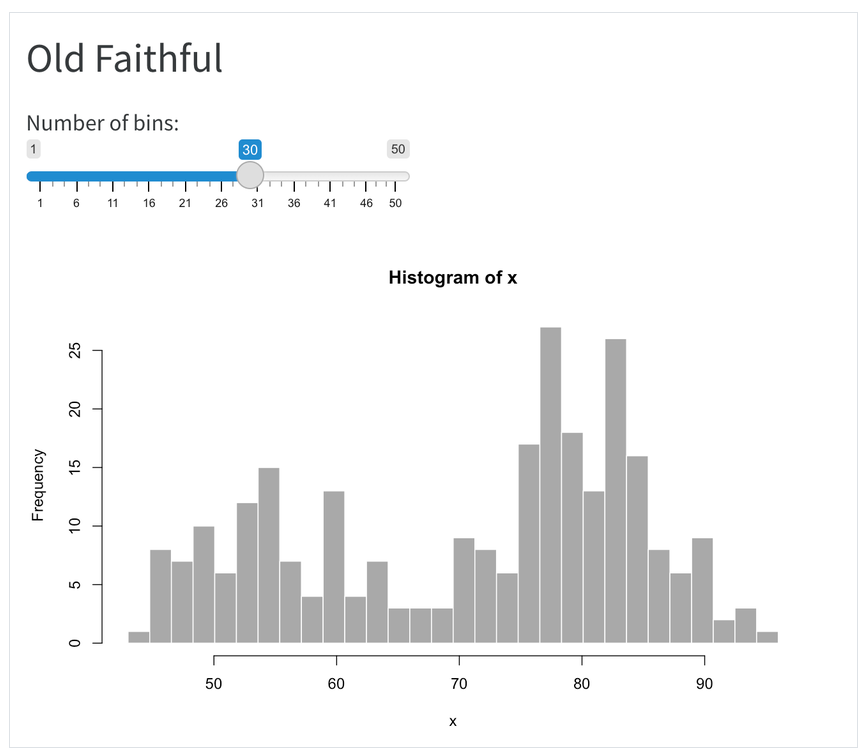
title: "Old Faithful"
format: html
server: shiny
---
```{r}
sliderInput("bins", "Number of bins:",
min = 1, max = 50, value = 30)
plotOutput("distPlot")
```
```{r}
#| context: server
output$distPlot <- renderPlot({
x <- faithful[, 2] # Old Faithful Geyser data
bins <- seq(min(x), max(x), length.out = input$bins + 1)
hist(x, breaks = bins, col = 'darkgray', border = 'white')
})
```
shinylive Quarto extension to run in a web browser (using webR or Pyodide)shinylive availablehtmlwidgets + HTMLtoolsAdd a dropdown:
htmlwidgets + HTMLtoolshtmlwidgetshtmlwidgetsbrowsable(
tagList(
dropdown_html,
g_girafe,
tags$script(HTML("
function filterByDropdown(selected) {
document.querySelectorAll('[data-id]').forEach(el => {
if (el.getAttribute('data-id') === selected) {
el.setAttribute('style', 'display:block;');
} else {
el.setAttribute('style', 'display:none;');
}
});
}
document.getElementById('dropdown').addEventListener('change', function() {
filterByDropdown(this.value);
});
// Run on initial load to filter by default selection
document.addEventListener('DOMContentLoaded', function() {
const initialSelected = document.getElementById('dropdown').value;
filterByDropdown(initialSelected);
});
"))
)
)htmlwidgets