Transport Demand Outliers
My PhD research focused on the development and use of functional analysis for detecting outliers in time series data, with case studies performed on multiple empirical data sets including railway booking data and bike-sharing usage data.
Project description
An outlier is generally considered an abnormal event that doesn’t fit with the pattern of events normally observed. In the transport setting, demand outliers might mean that there are a lot more (or less) passengers than normal, or that they book earlier than normal, or that passengers are willing to pay more than they normally would for the same ticket. There are many things that can cause these changes in demand such as, football matches, weather, or public holidays. Some of these events e.g. Christmas, are known about in advance and can be accounted for in the planning process. Others are not known about. And it’s these changes in demand that we want to identify. Ideally, they’d be identified as early as possible, in order for the transport company to take action.
It’s important to detect changes in demand for multiple reasons. Transport companies set prices and ticket availability based on forecasts of demand. If the demand no longer matches the forecasts, then the prices that have been set are no longer optimal. Then transport companies lose revenue. It could also result in transport services being busier than expected. If you’ve ever gotten on a packed train and been unable to get a seat, you know that incorrectly managed demand isn’t desirable for passengers either.
At the moment, many transport companies employ analysts to monitor the number of bookings. However, as human beings, we’re not very good at spotting things by eye, and we tend to see patterns that don’t exist. This research develops a statistical method to identify demand outliers and send alerts to analysts.
Developing outlier detection methodology
Most transport providers store information about bookings as a time series. For example, for train ABC departing on January 31 at 10:00, there is a series of observations of how many passengers had booked tickets by 3 months per departure, 1 month before departure, 1 week before departure … You get the idea.
Note: we’ll mainly be talking about trains here, but it’s all generalisable to other types of transport systems.
So for a set of departures, we would have a collection of time series that might look a bit like this:
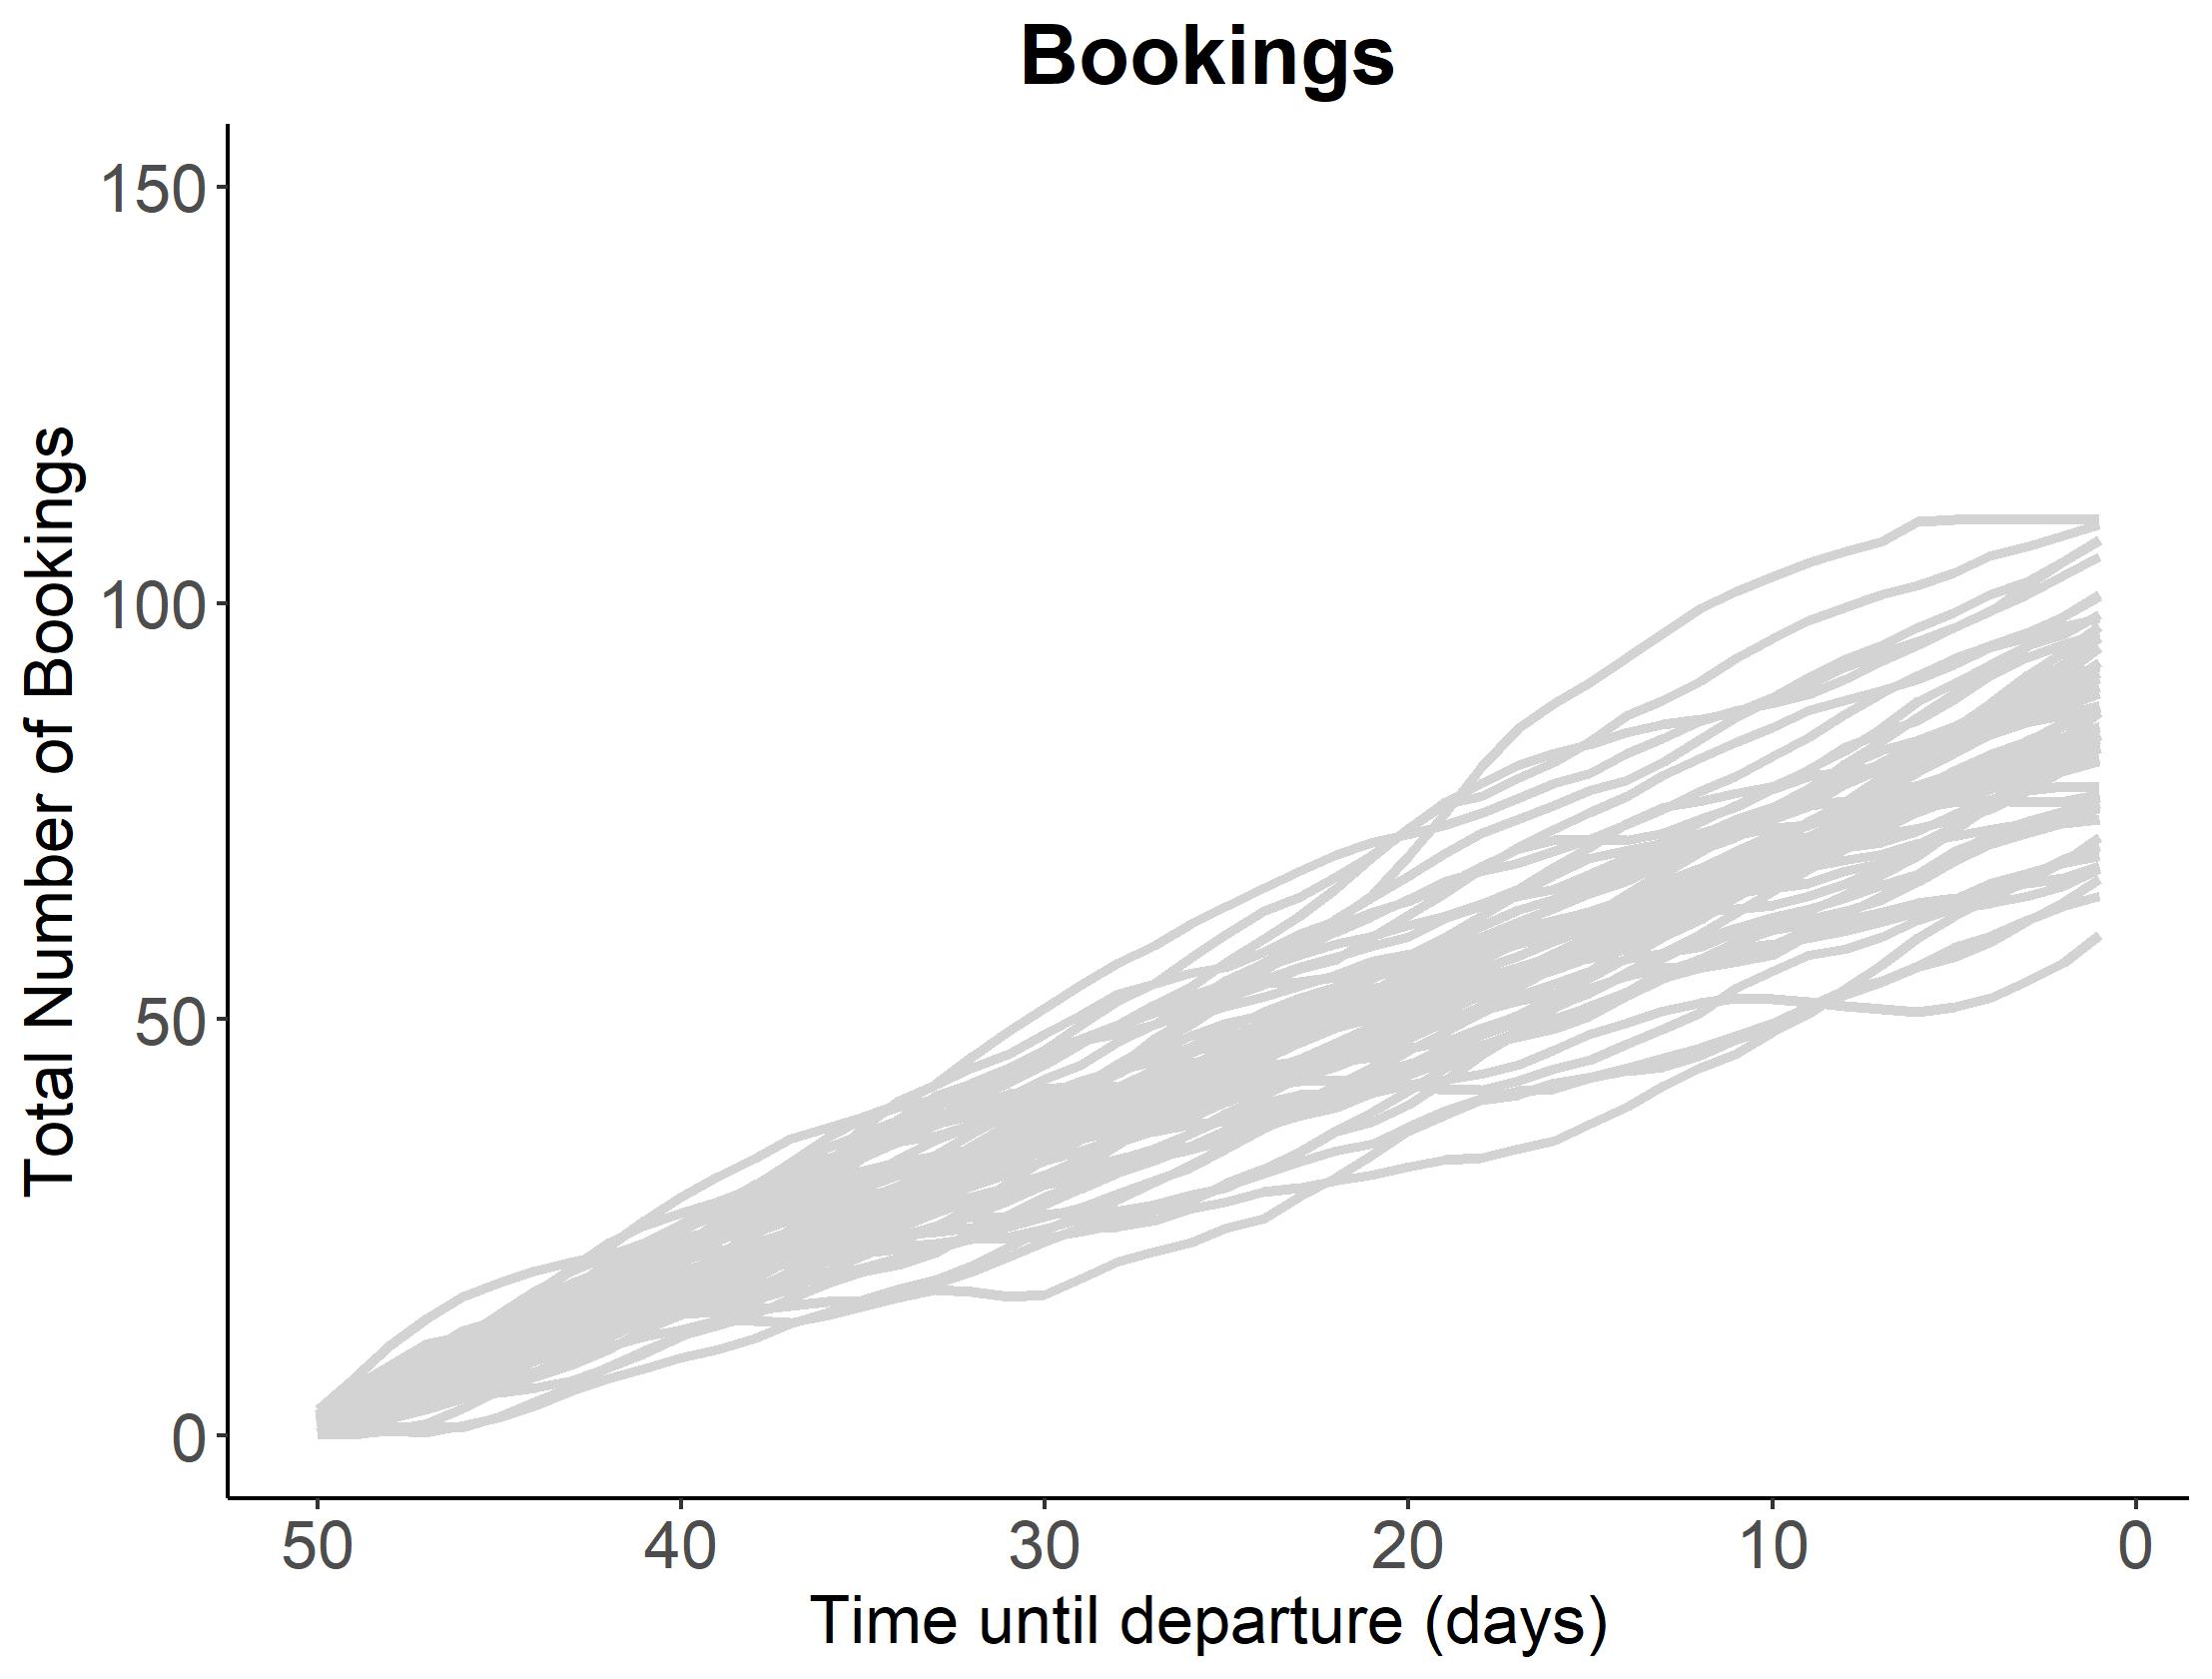
To detect outliers within this set of time series, we use functional analysis. Functional analysis treats each time series of bookings as an observation of a continuous function. We calculate the functional depth of the time series of bookings for each train. I won’t go into all of the details about the equations for calculating the functional depth because they’re not very nice. But generally, depth measures provide us with an ordering of the time series – where the time series closest to the centre i.e., the median, has the highest depth, and that in the tails of the distribution i.e. outliers, have low depth. This allows to consider both changes in magnitude (e.g. a big increase in bookings), and shape of booking patterns (e.g. passengers booking earlier than normal). Outliers are detected by setting a threshold for the functional depth. Any time series with a functional depth below that threshold is classified as an outlier.
Of course, we don’t just want to identify demand outliers in historic data (although this can still be beneficial on its own). We want to identify these outliers as they are happening, so that an analyst can make an adjustment. We found that forecasting the bookings still to come in, and performing the outlier detection on the forecasted bookings, helped us to identify the outliers earlier.
Developing methodology for networks
The vast majority of, if not all, transport systems do not simply consist of a single journey from A to B. There are often many places where passengers can start and end their journey, and multiple combinations to get between the two. It’s quite unlikely that any demand changes will only affect one single part of the transport network e.g. a single leg of a train journey. It’s also quite unlikely that the entire network will be affected by demand changes in the same way at the same time. Before even thinking about demand outliers, we developed a method split up the network into clusters that experience demand in similar ways. Our outlier detection method could then be applied jointly to legs in the same cluster which are likely to share common outliers.
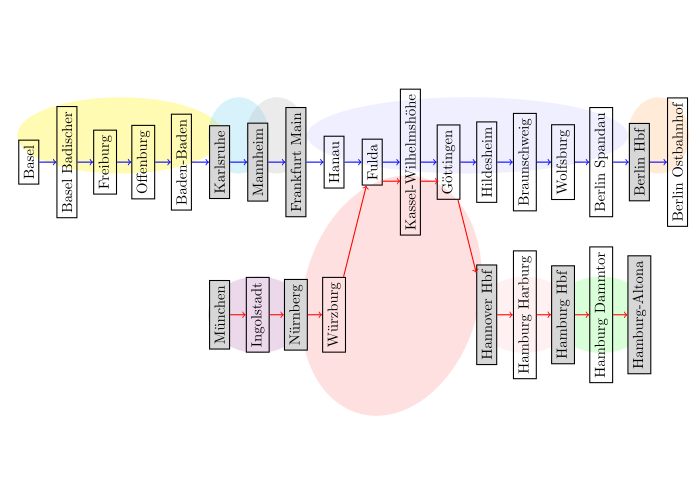
Railway networks
Through collaboration with Deutsche Bahn, the German rail provider, we were able to test the methods developed on their data. We tested our methodology on a section of the Deutsche Bahn network consisting of two train lines - (i) from Munich to Hamburg and (ii) from Basel in Switzerland to Berlin. Generally, legs in the same train line were clustered together, and the edges of the clusters coincided with major train stations.
Bike-sharing networks
Of course, it’s not all about trains. There are many other industries where detecting and accounting for systematic changes of demand is of interest. One of those industries is bike-sharing – where members of the public can pick-up a bike at a terminal and return it to any other terminal. Most bike-sharing systems are located in cities. Since some areas of a city are more populous than others, the bikes must be redistributed from the terminals that are commonly used as drop-offs to those that are commonly used for pick-ups. Although, a responsive approach could be taken to redistributing bikes i.e. only sending drivers to a terminal when it is full or empty, this isn’t very efficient.

If we are able to identify and predict when unusual demand patterns occur, bike-sharing companies can better organise their resources. A case study of the Capital Bikeshare system in Washington D.C. finds that there are spatial and temporal patterns to the outliers that occur.
Overall, a key finding of this research is that functional data analysis is a very powerful tool for identifying demand outliers. However, features of the data such as network effects or seasonal patterns need to be taken into account first. More research into how an outlier-based alert system could be implemented in an automated way is still needed.
Building a proof-of-concept dashboard
The initial motivation for this research was to support analysts who monitor the number of bookings, sending them alerts when an intervention is required. To communicate the alerts to the analysts, I developed a proof of concept dashboard that uses the results of the statistical methods to generate a list of alerts that analysts can explore in more detail.
Related publications
Outlier detection in network revenue management.
N. Rennie, C. Cleophas, A. M. Syksulski, F. Dost. OR Spectrum. 2023. doi:
doi.org/10.1007/s00291-023-00714-2.
Analysing and visualising bike sharing demand with outliers.
N. Rennie, C. Cleophas, A. M. Syksulski, F. Dost. Discover Data. Volume 1, Issue 1. March 2023. doi:
doi.org/10.1007/s44248-023-00001-z
Identifying and responding to outlier demand in revenue management.
N. Rennie, C. Cleophas, A. M. Syksulski, F. Dost. European Journal of Operational Research. Volume 293, Issue 3, 16 September 2021, 1015-1030. doi:
doi.org/10.1016/j.ejor.2021.01.002.
Detecting demand outliers in transport systems
N. Rennie. PhD Thesis. 2021. doi:
doi.org/10.17635/lancaster/thesis/1448.