Dashboards
Apps and dashboards
I have developed several dashboards and applications, covering a variety of topics and uses, and a few are highlighted here:
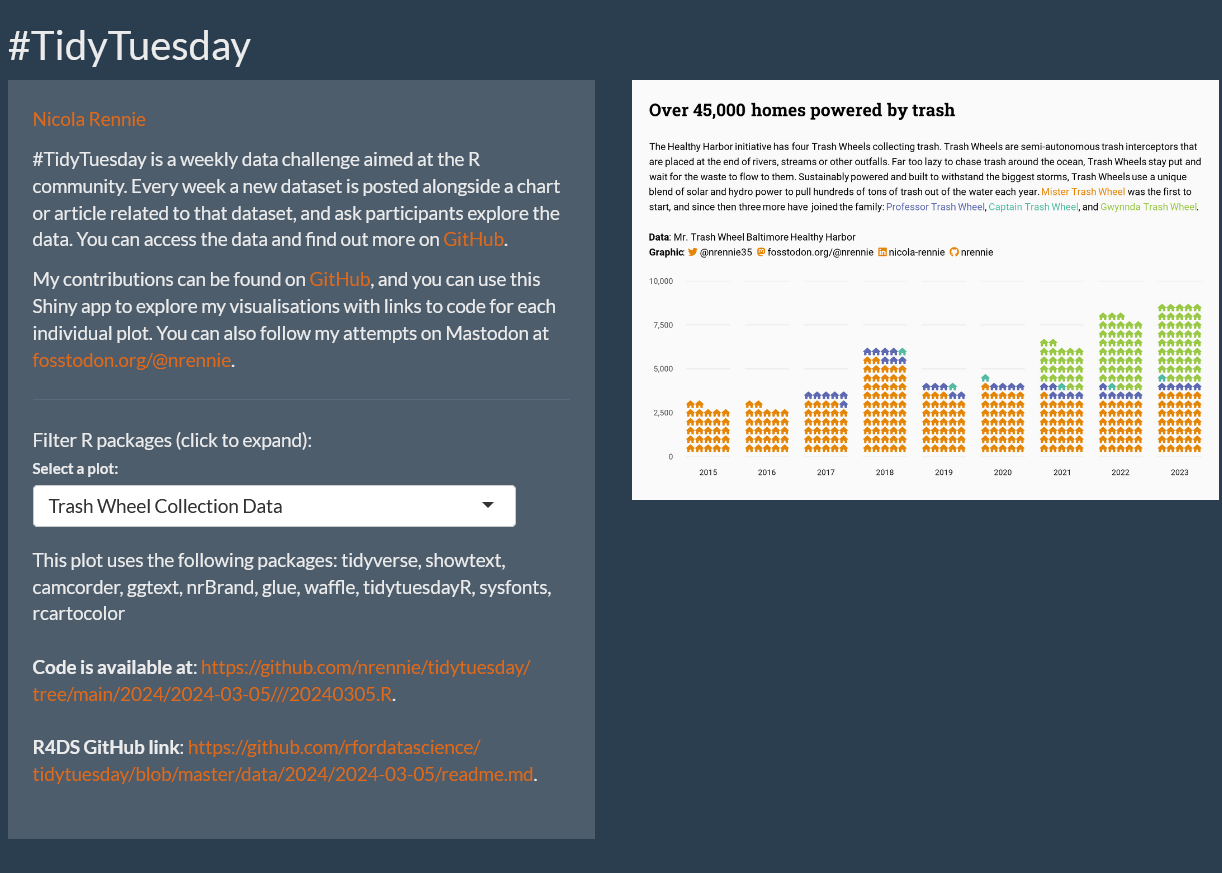
TidyTuesday
An app that displays every TidyTuesday plot I’ve created, with functionality to search by packages used in creating the plots and links to the original code and data, that updates by itself whenever I create a new plot. This app is deployed using Shinylive for R, meaning it runs in the user’s web browser and does not require an R server. Read my blog post describing the process of building and deploying this Shiny app.
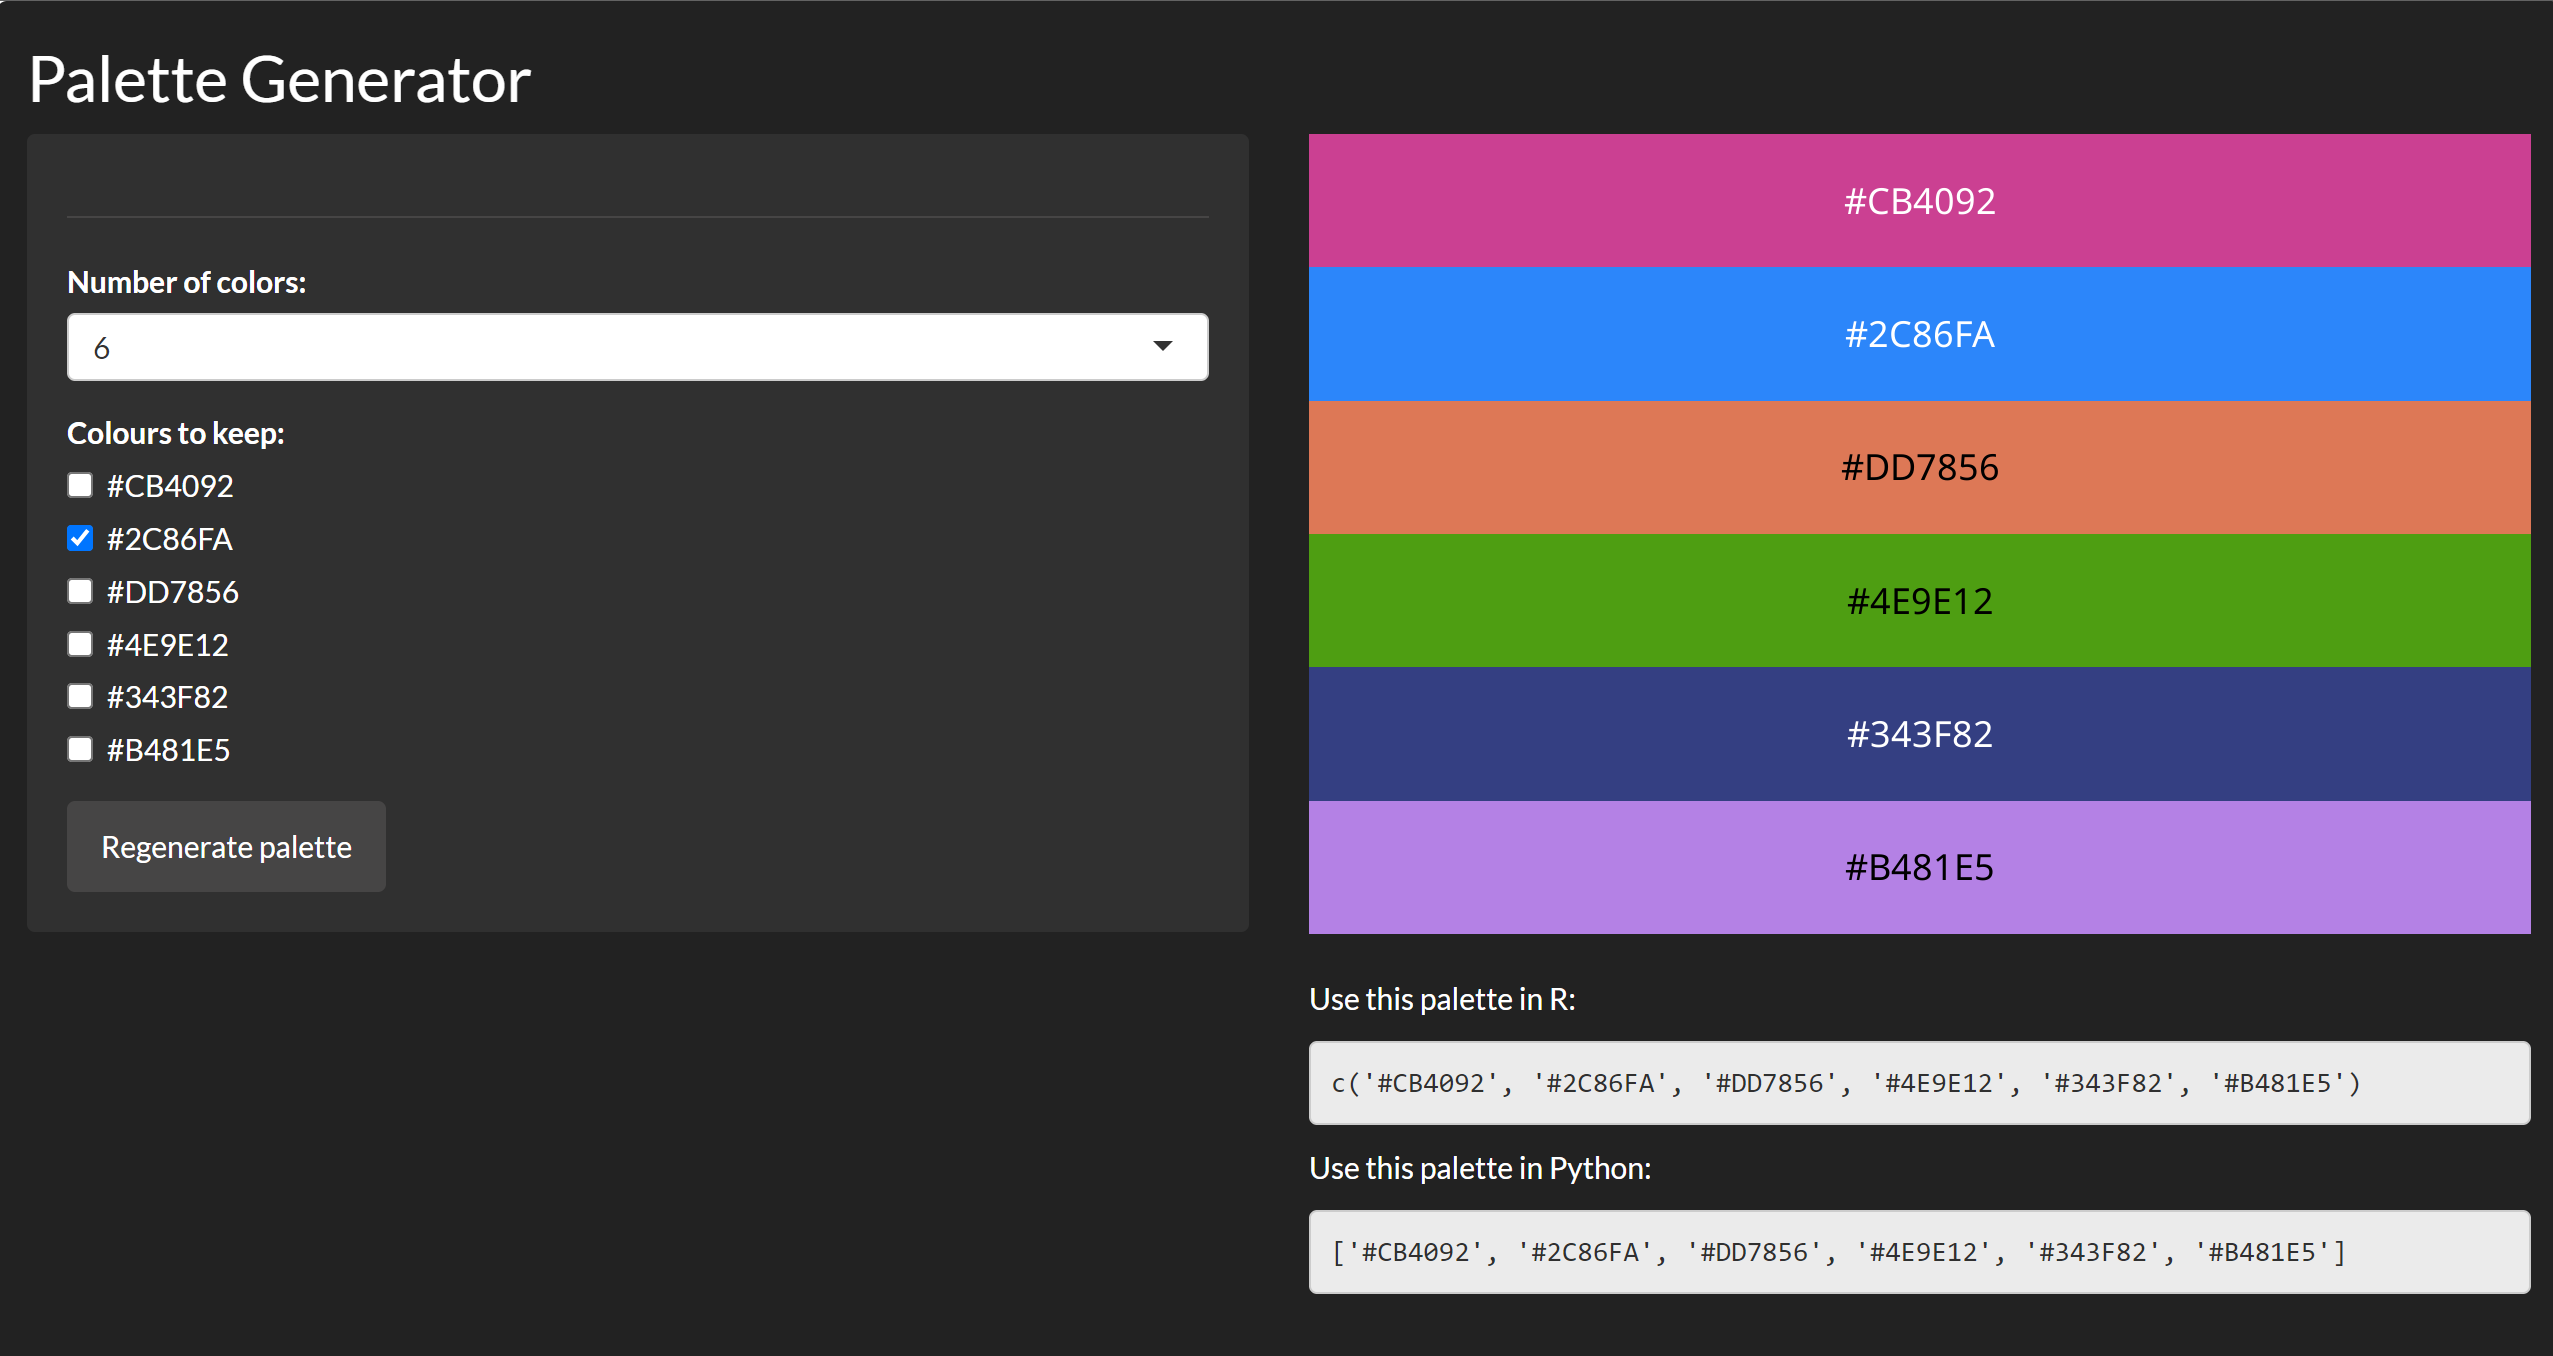
Palette Generator
An app that generates random colour palettes with up to 12 colours, with users able to choose which colours remain in the next palette generation. Code to use the palettes in R and Python is generated alongside the palettes. This app is also deployed using Shinylive for R.
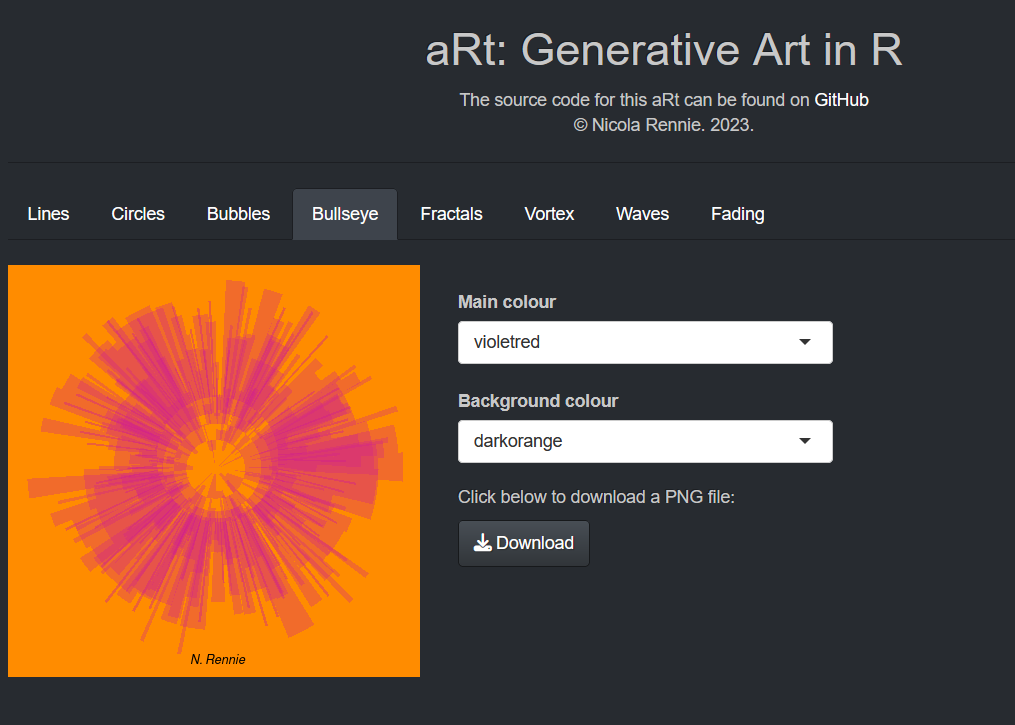
aRt
An application to generate and download generative art created in R. The app allows people to choose a piece of generative art, set colours and other parameters, then click a button to download a PNG file of the art.
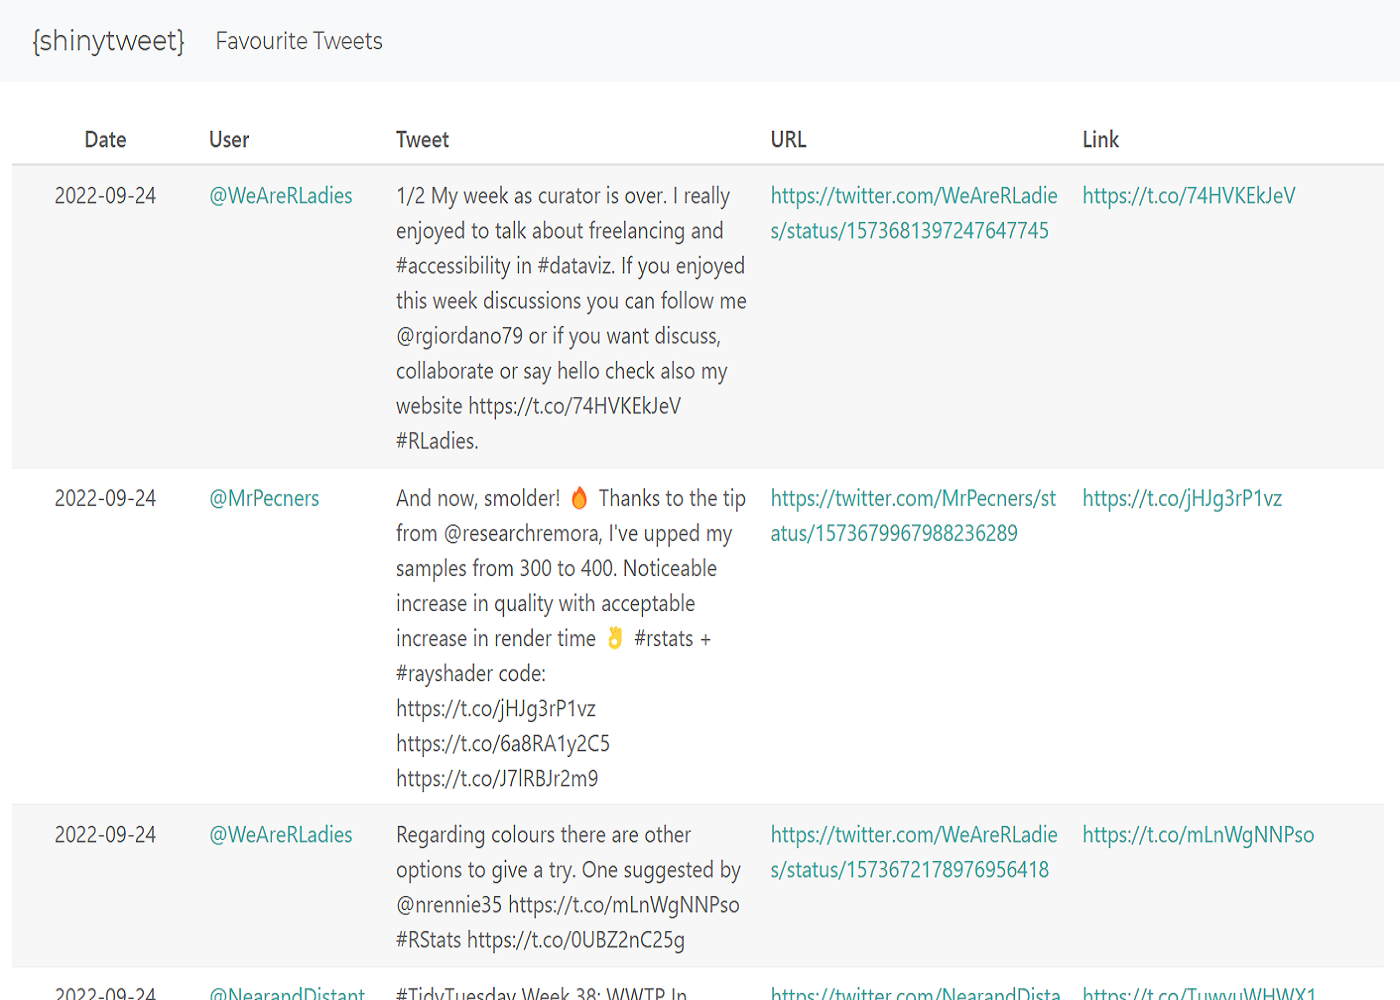
shinytweet
A simple R shiny application to browse tweets related to R, Python, and data science. This app uses GitHub actions to automatically update data and redeploy the shiny app.
Read my blog post about creating, deploying, and updating this Shiny app for more information.
Outlier Detection
An R shiny dashboard based on my PhD research to detect outliers in functional time series data occurring in a network in an online setting. Accompanies the paper titled “Detecting outlying demand in multi-leg bookings for transportation networks”.
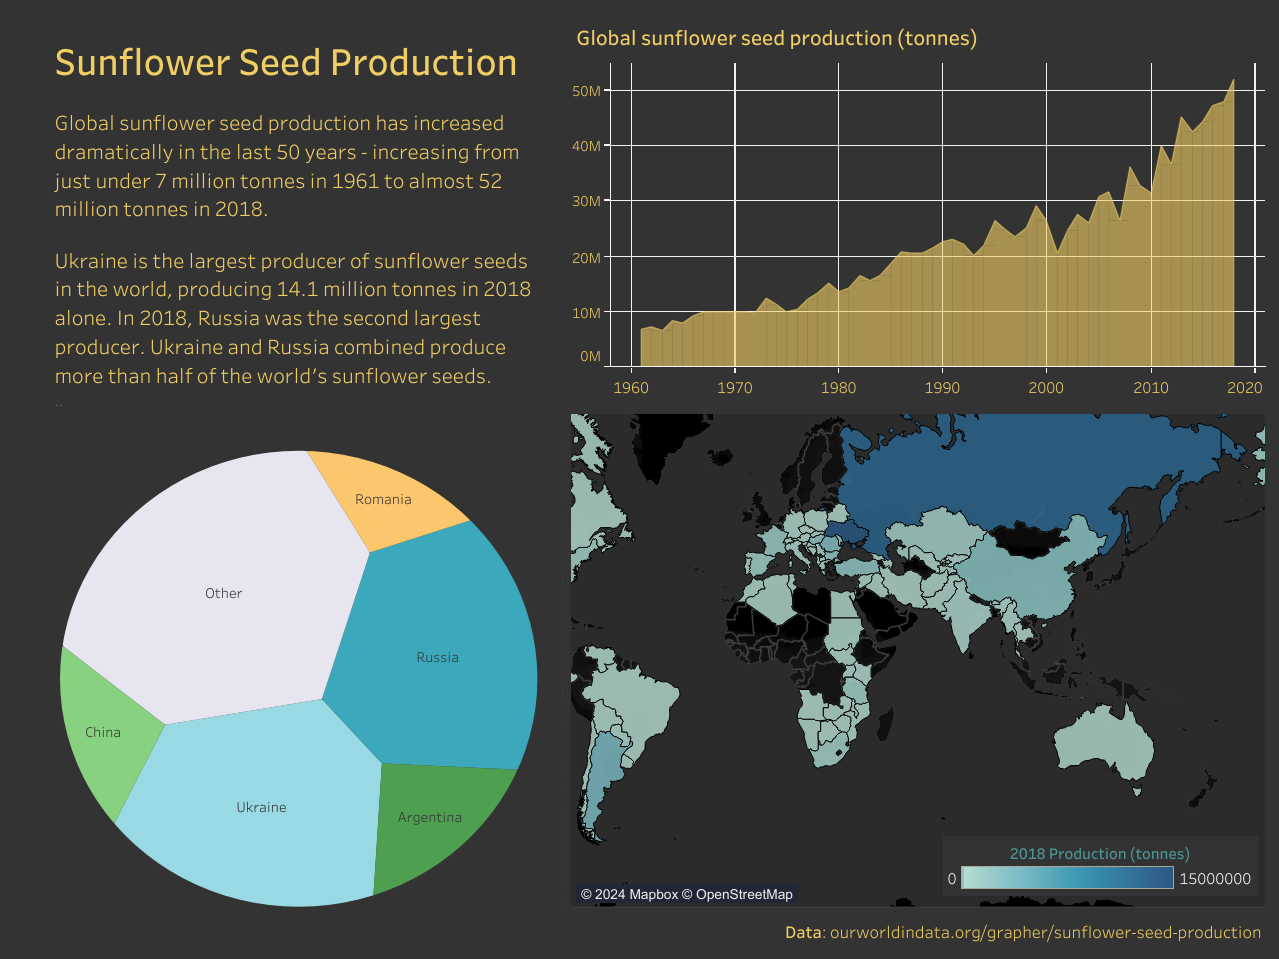
Sunflower Seed Production
As part of the #30DayChartChallenge in 2022, I created a dashboard of Sunflower Seed Production using Tableau. You can view the app on my Tableau Public profile.