About me
Book of case studies of artistic visualisations of data
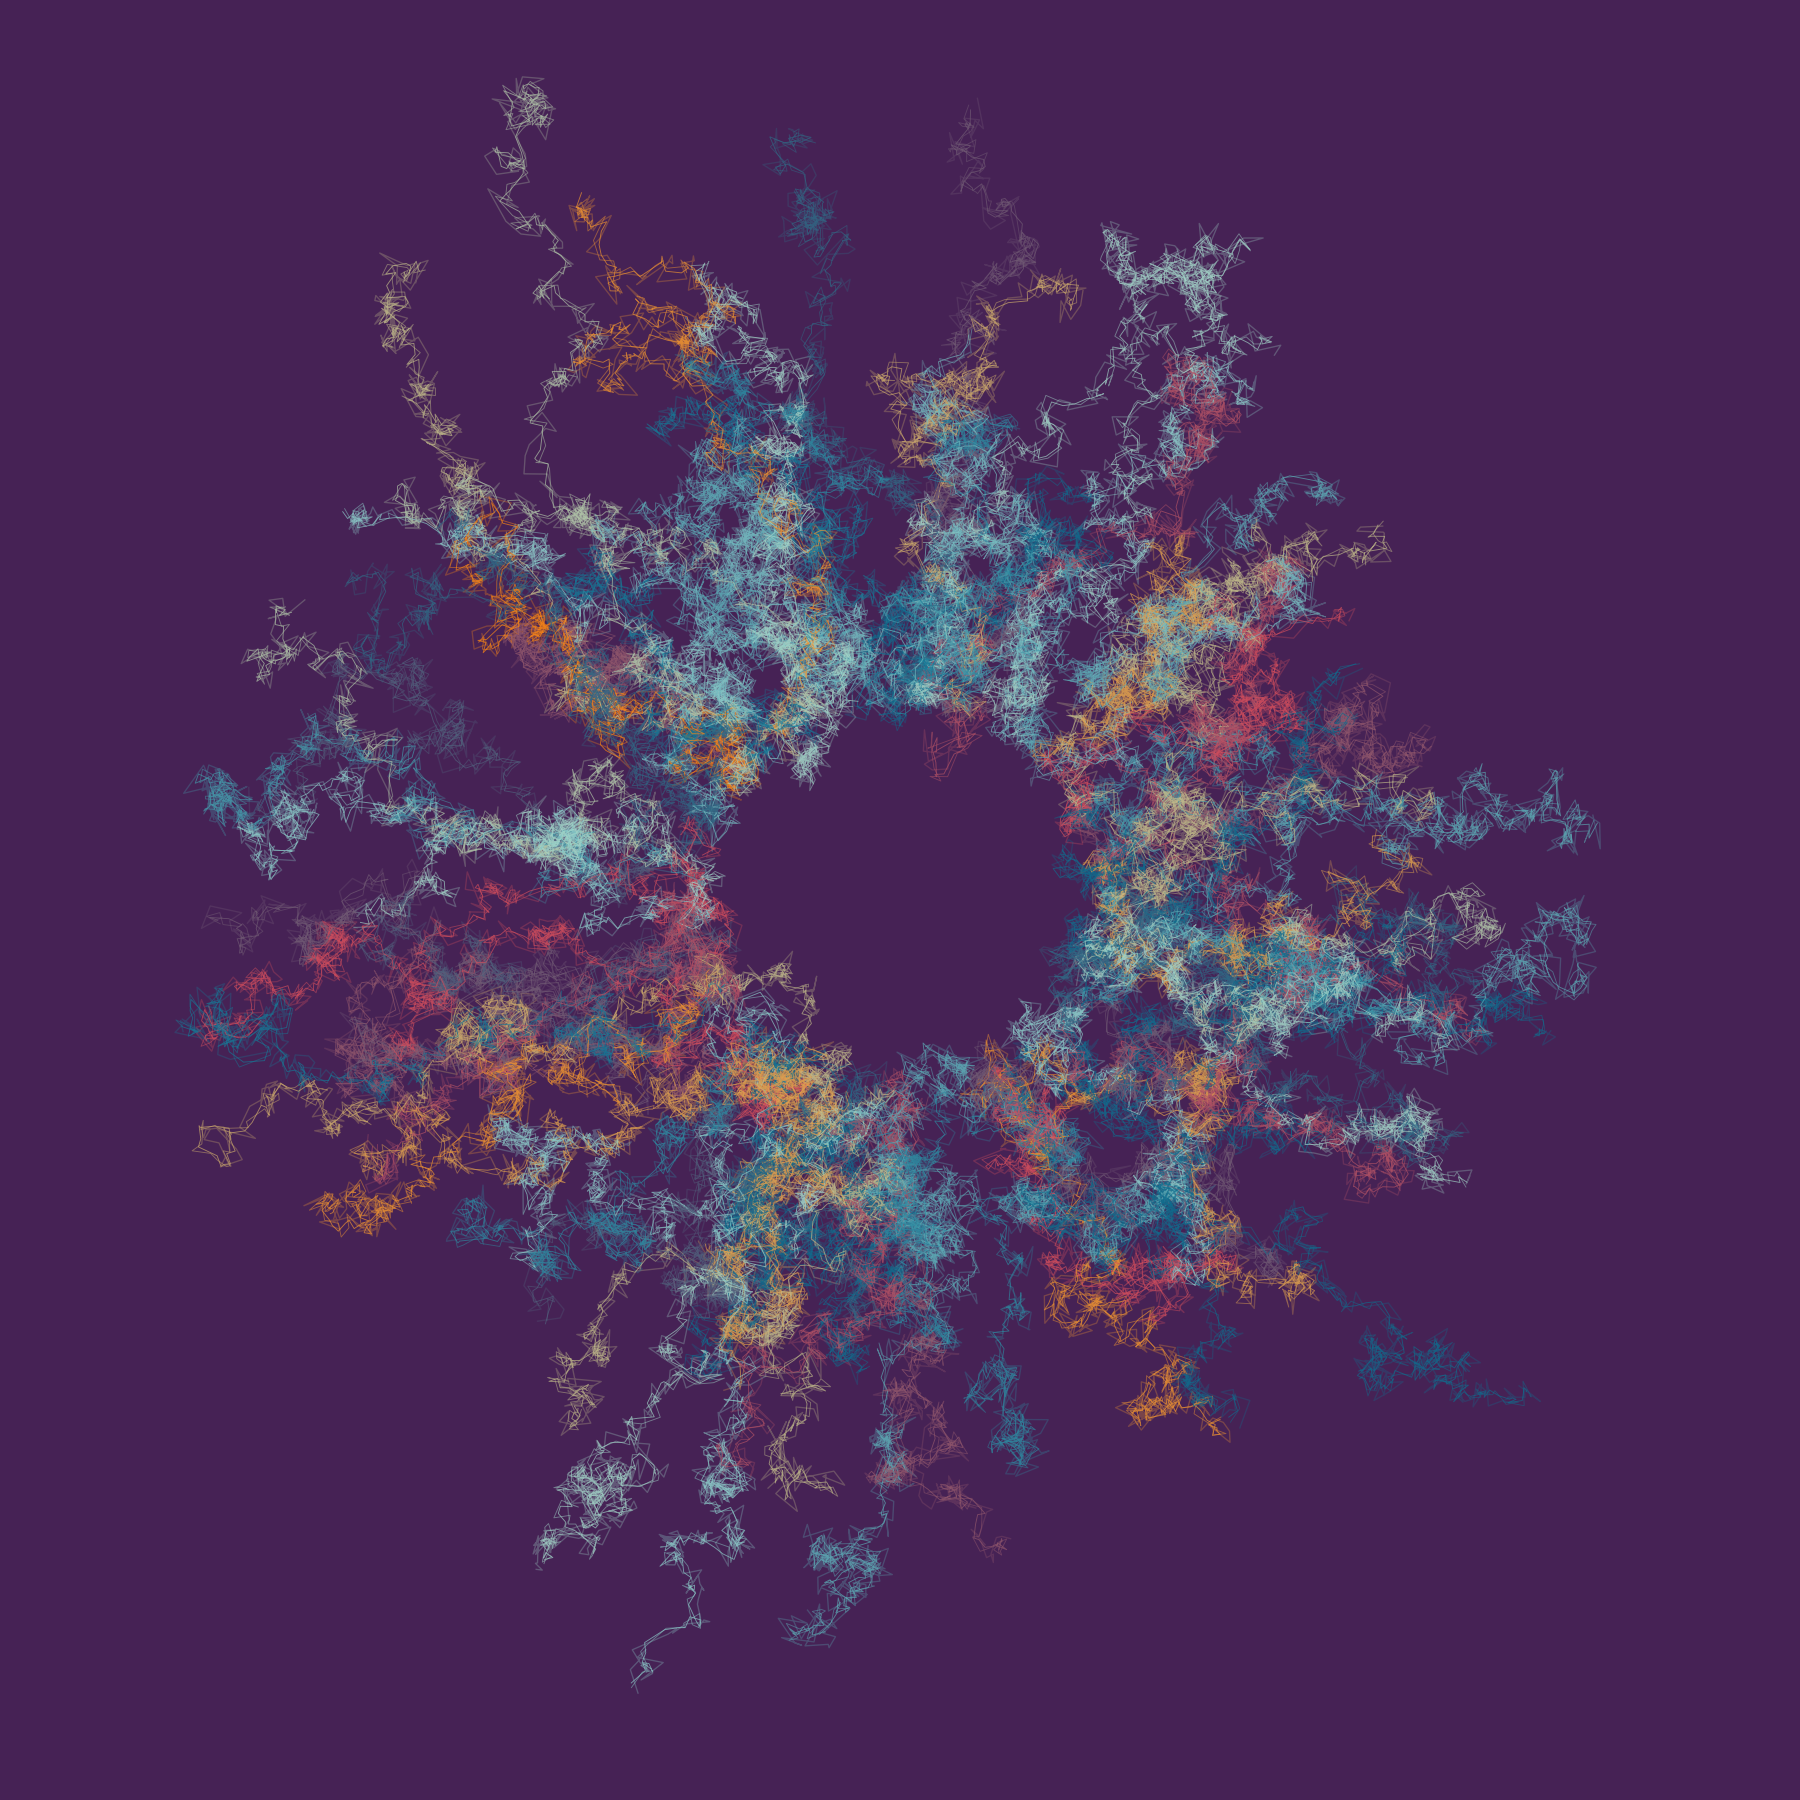
Abstract interpretations of real data
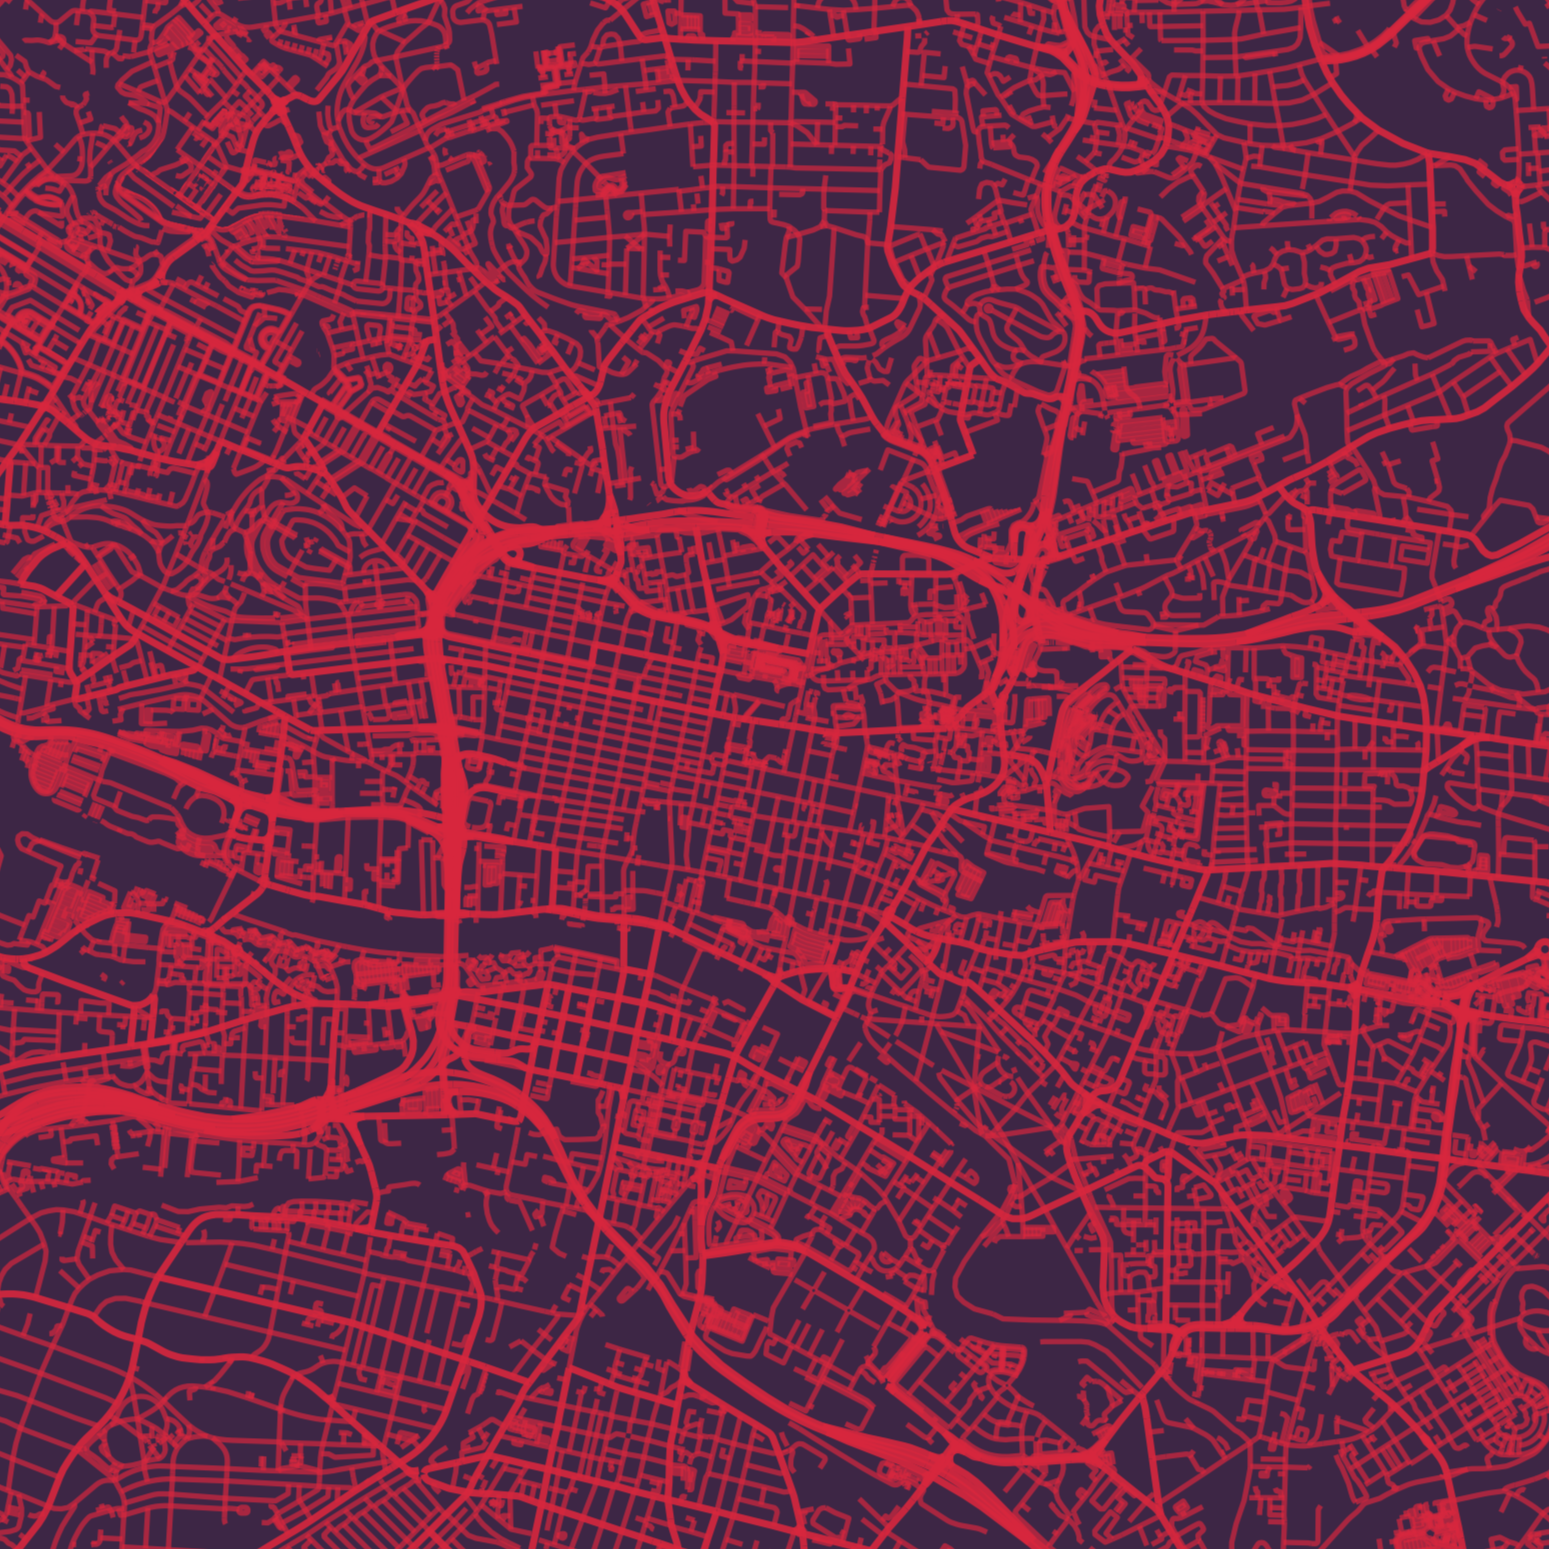
Artistic maps of OpenStreetMap data
Visualising five years of my life
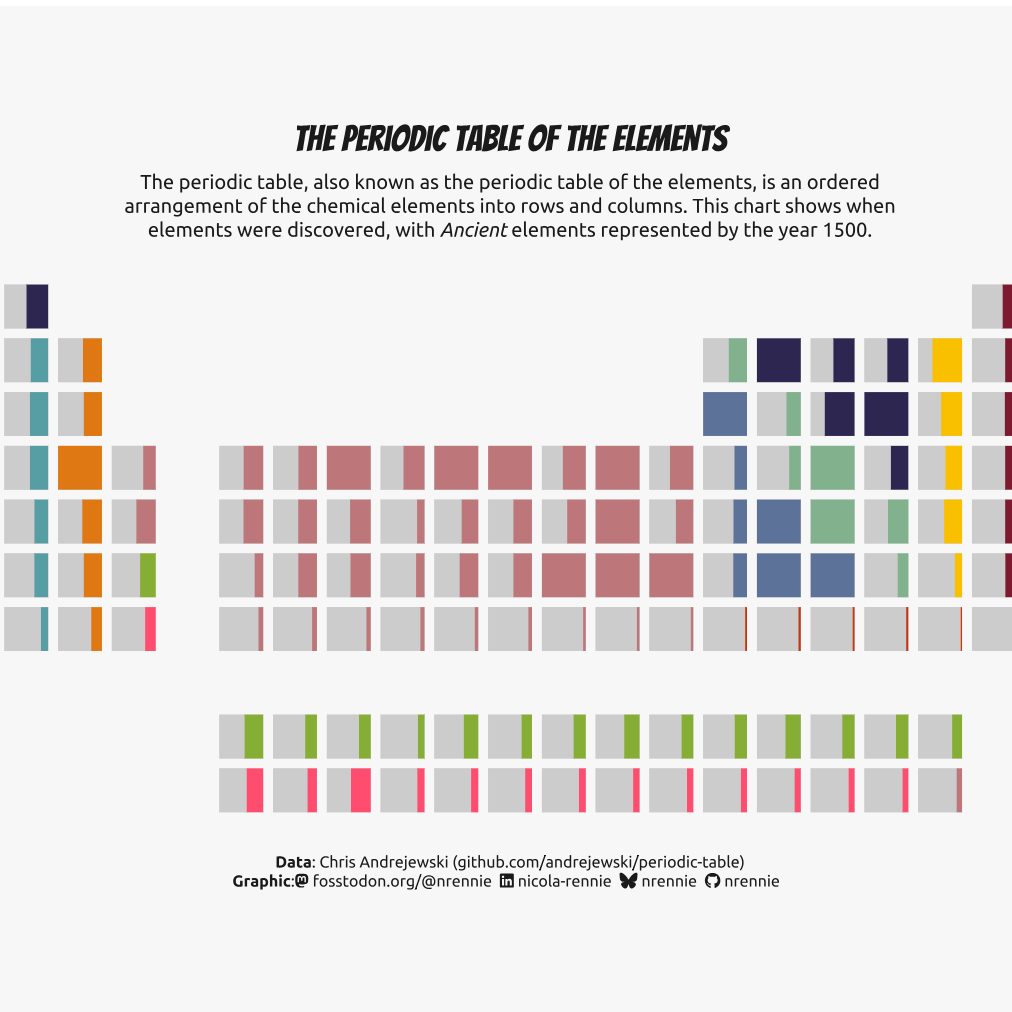
Communicating data and information
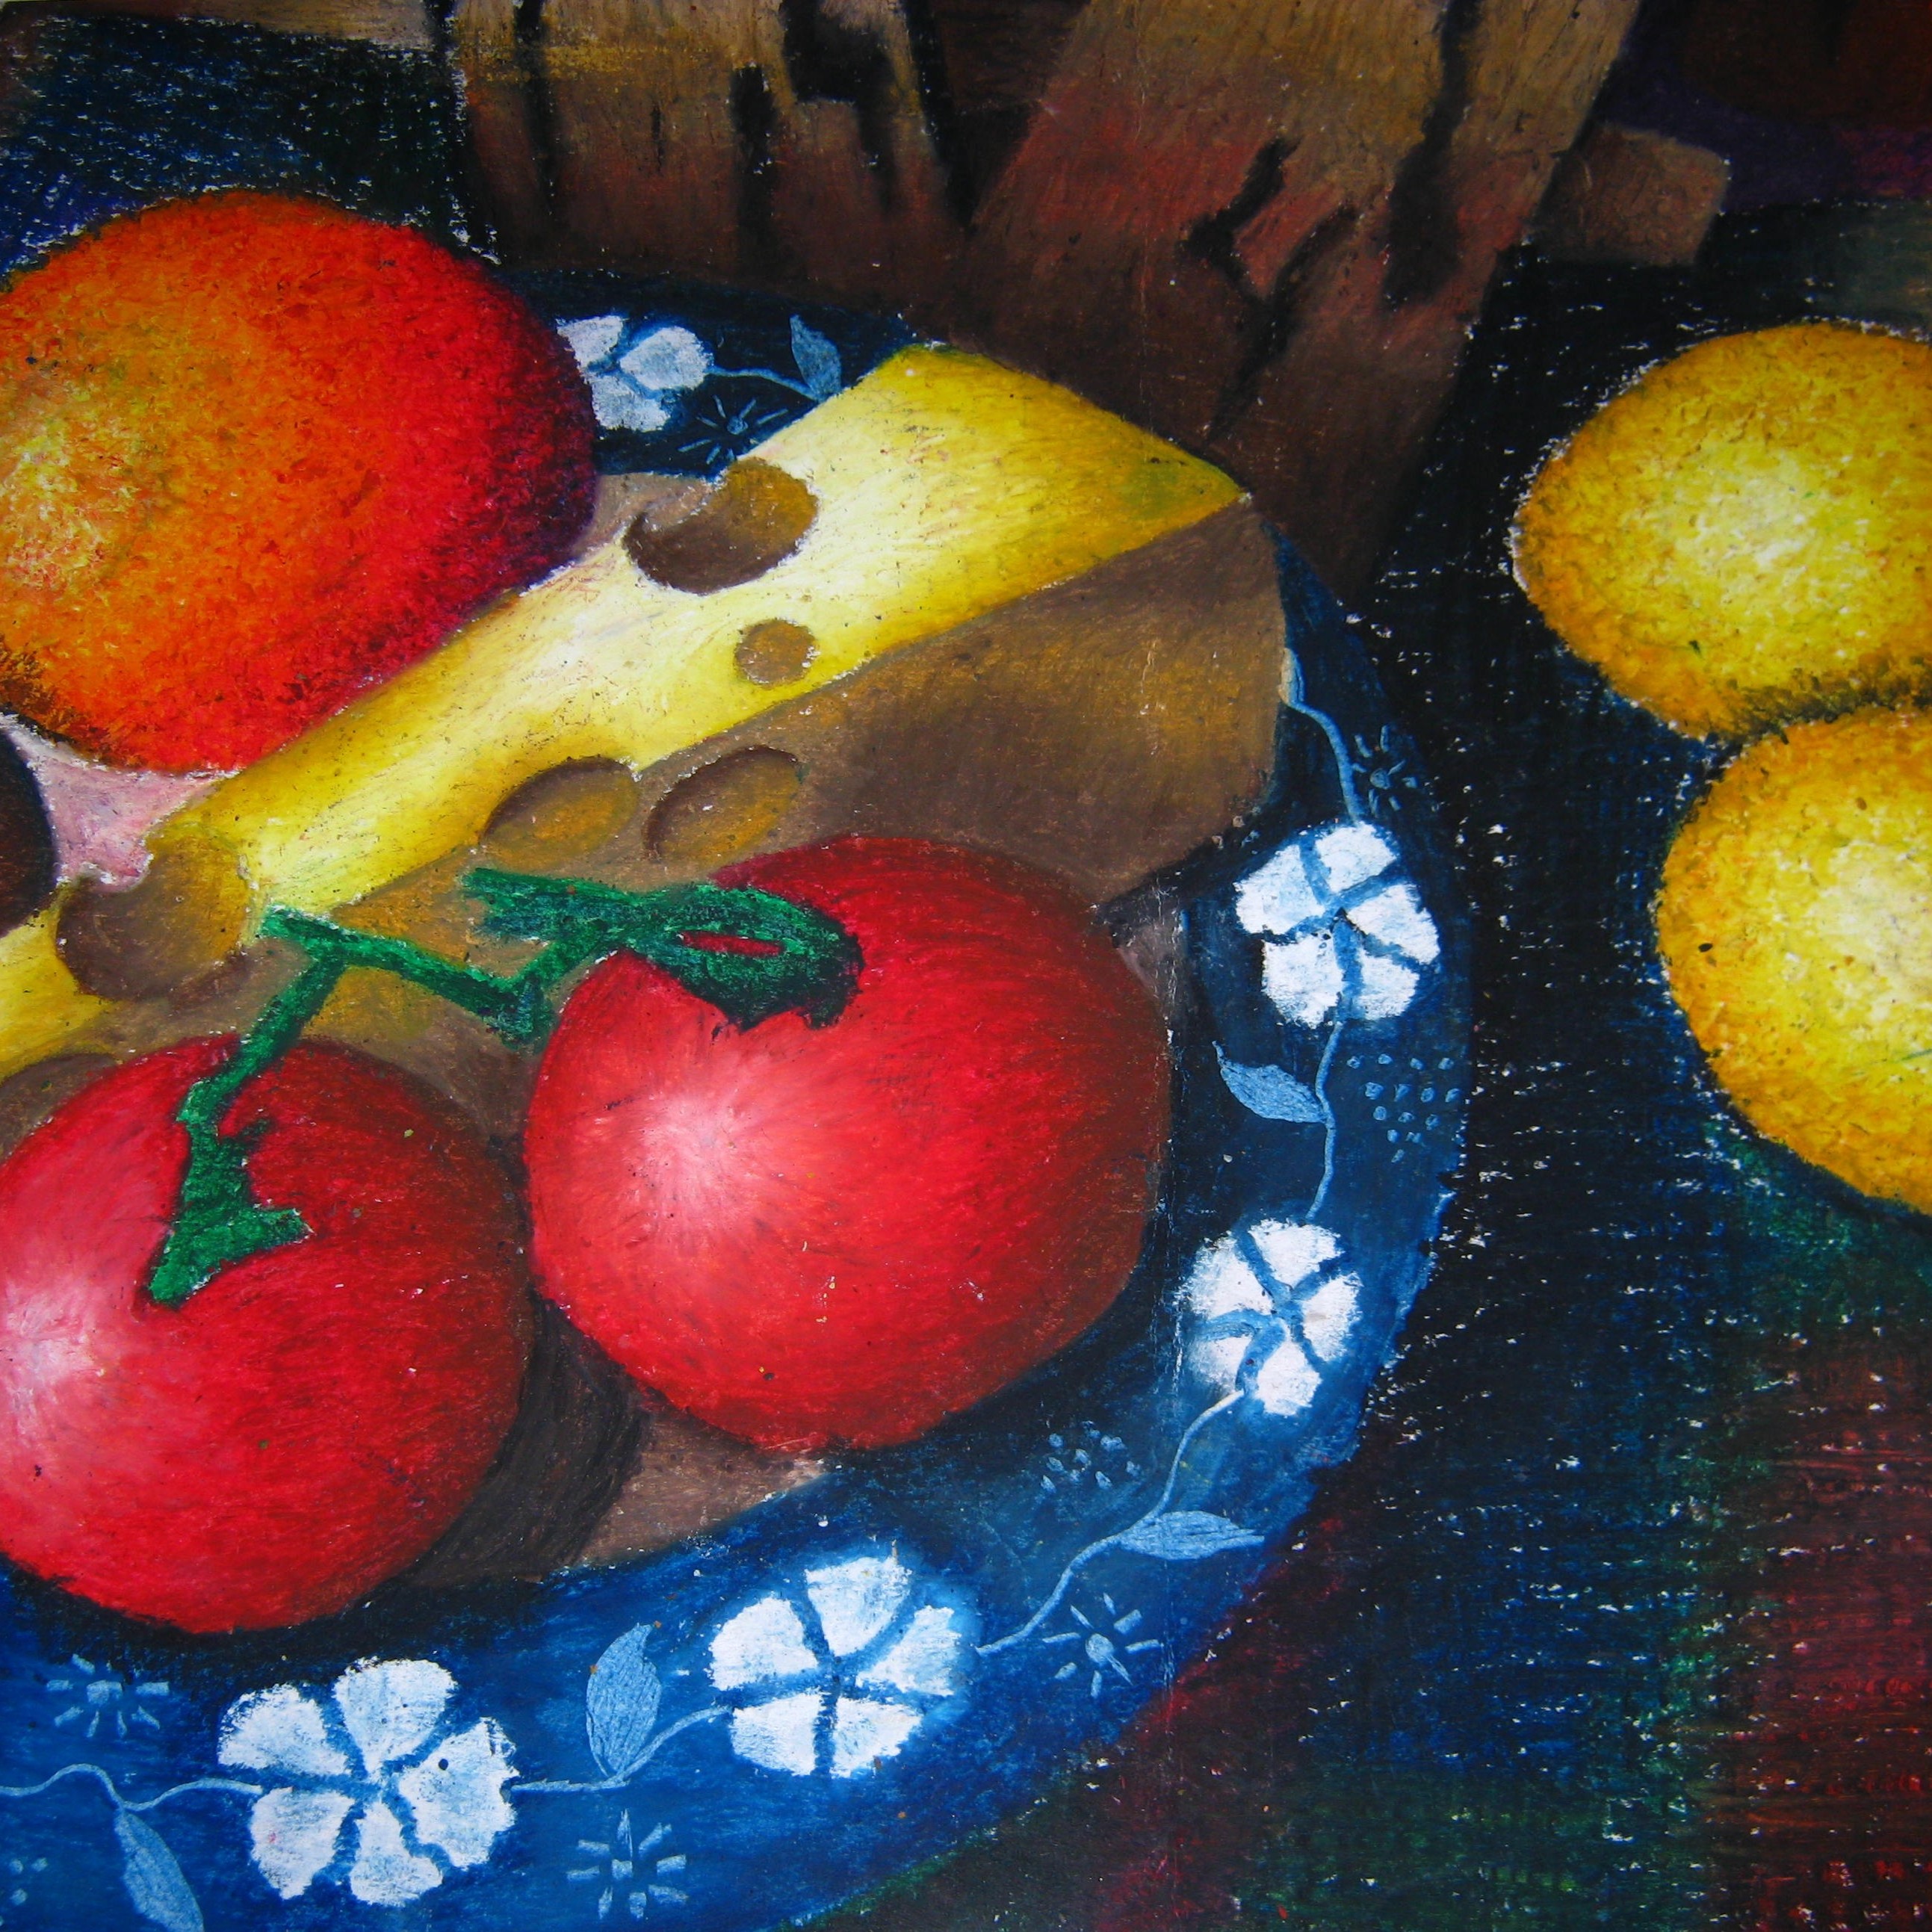
Paintings created with physical media
Art generated from code
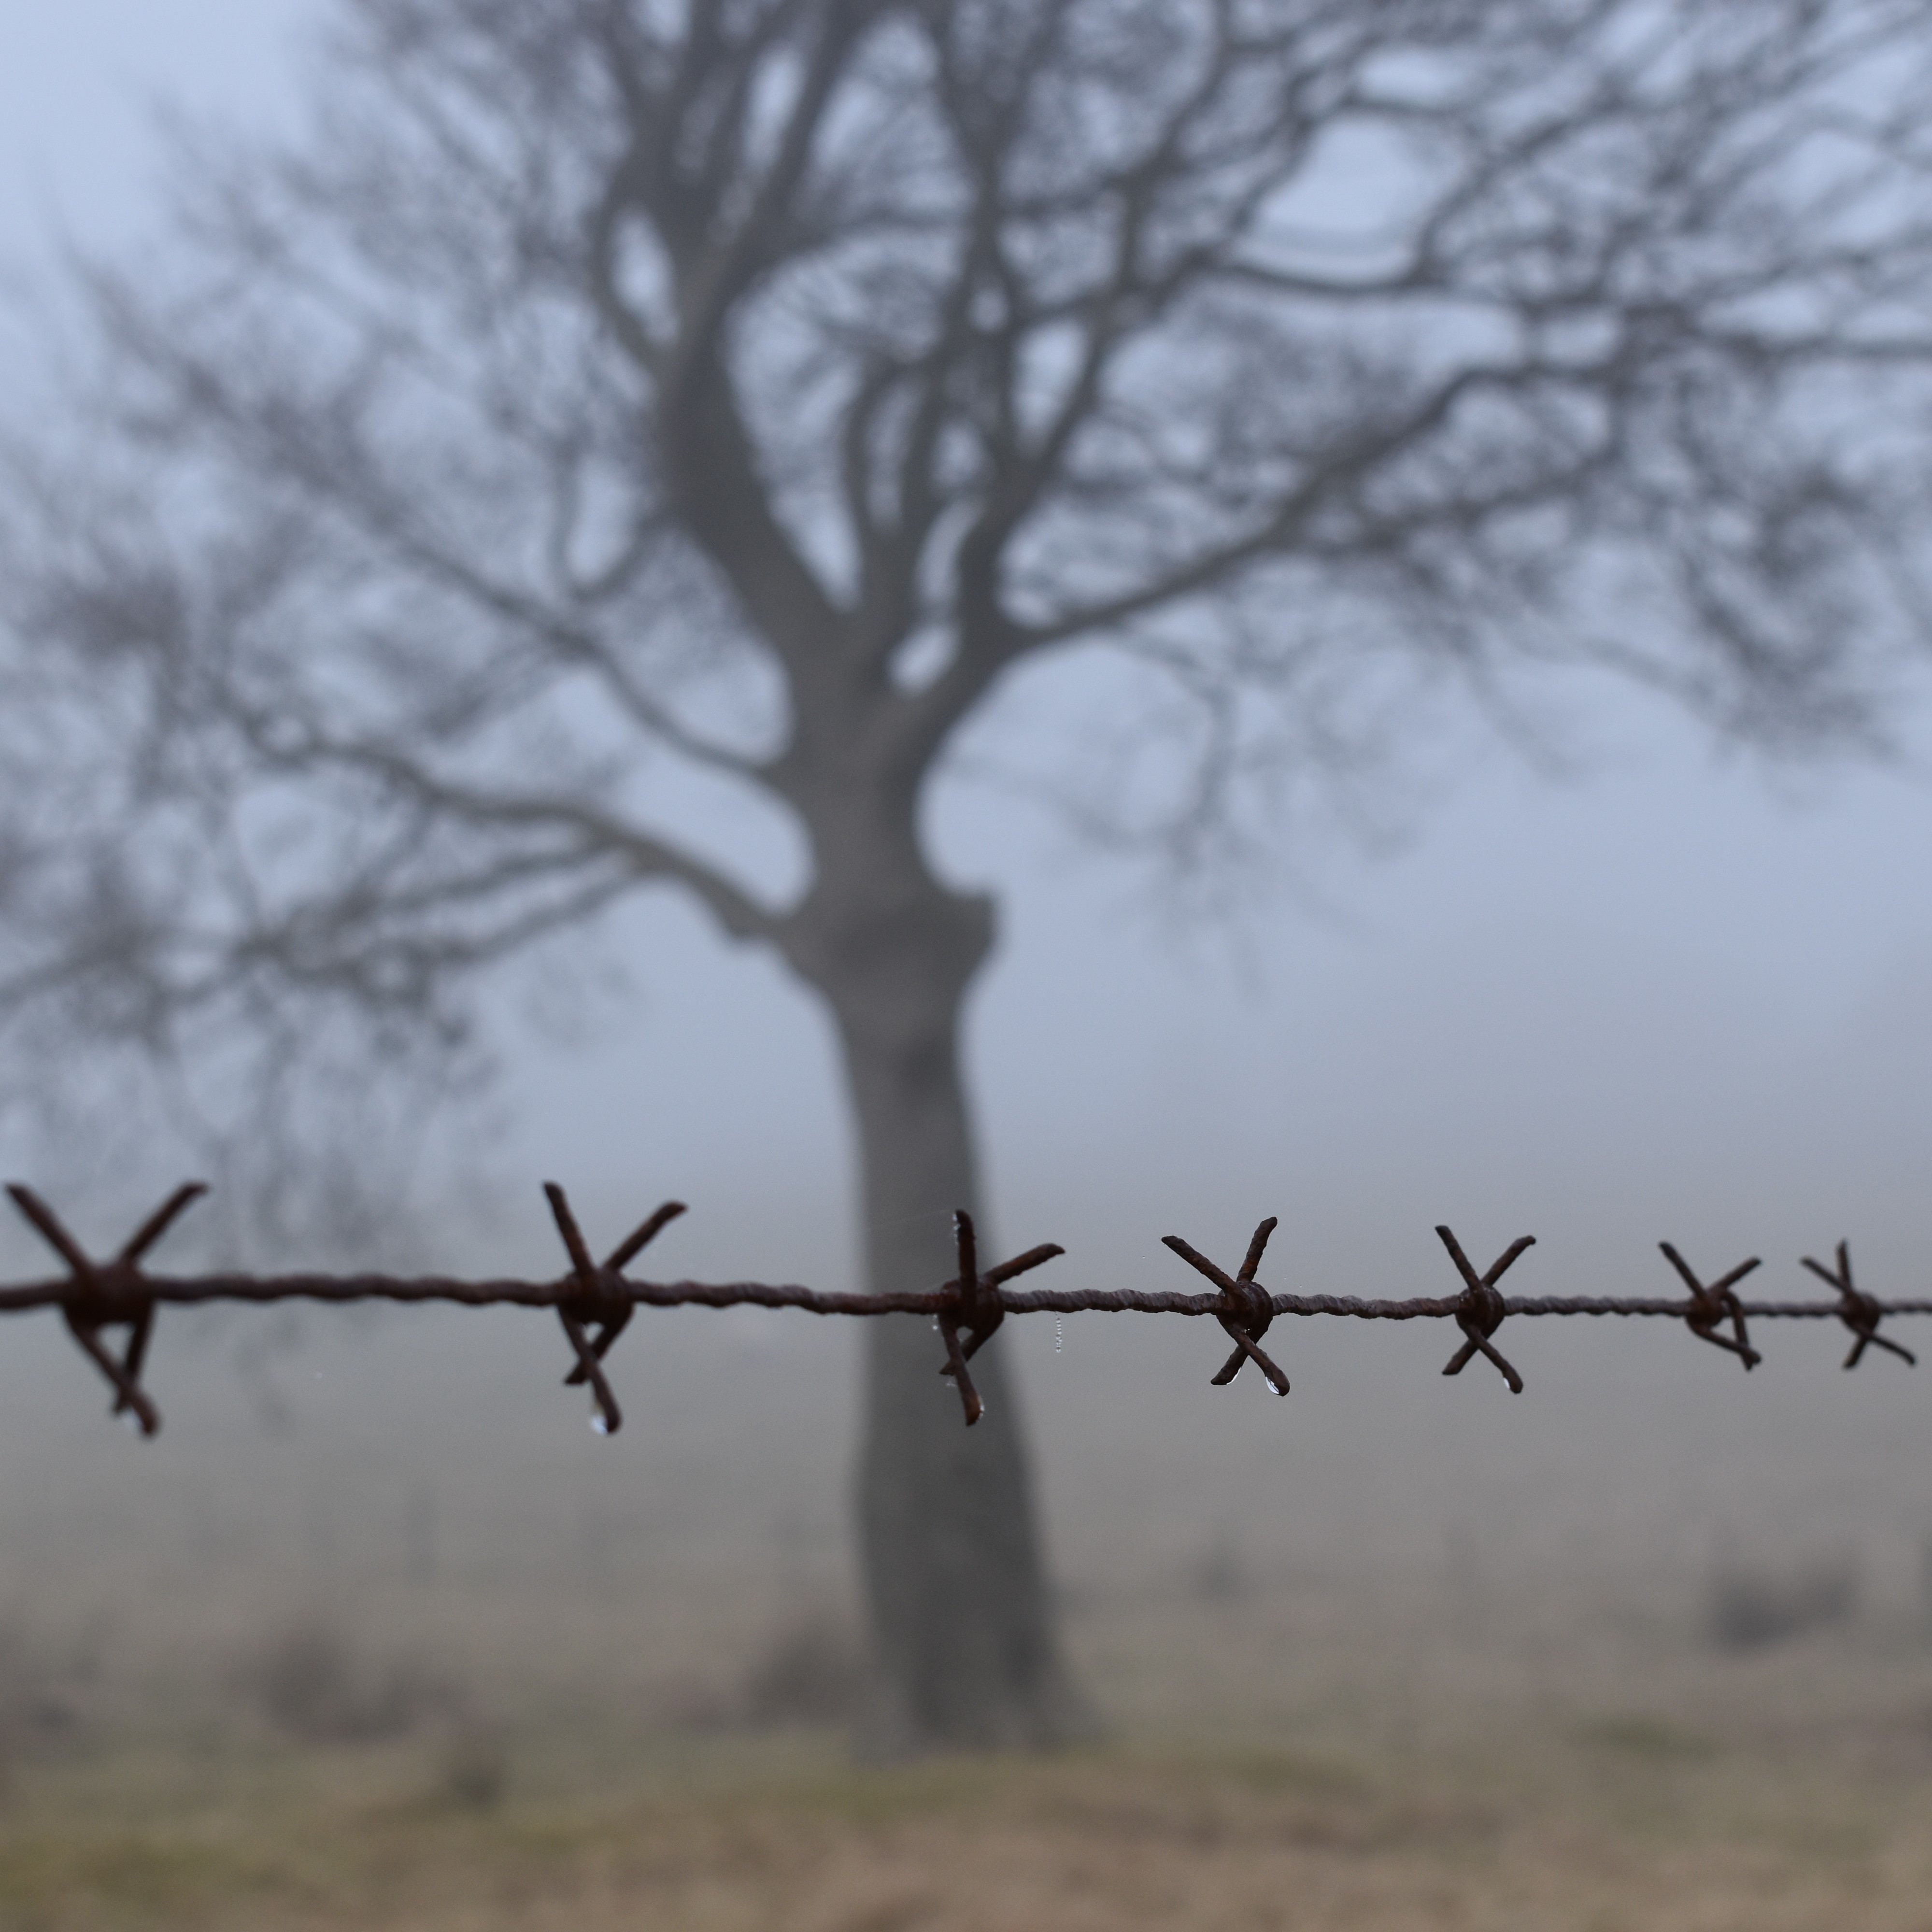
Collection of landscape photography