Southern Resident Orca Encounters

Return to Data Art Gallery.

R
Code
# Packages
library(ggplot2)

# Data
tuesdata <- tidytuesdayR::tt_load("2024-10-15")
orcas <- tuesdata$orcas

# Colours
col_palette <- c("grey70", "grey80", "grey90", "white")
na_col <- "black"
bg_col <- "black"

# Wrangling
start_date <- lubridate::ymd("20180101")
end_date <- lubridate::ymd("20231231")
plot_data <- orcas |>
  dplyr::select(date) |>
  dplyr::count(date) |>
  dplyr::filter(date >= start_date & date <= end_date) |>
  tidyr::complete(
    date = seq.Date(start_date, end_date, by = "days"),
    fill = list(n = NA)
  ) |>
  dplyr::mutate(
    year = lubridate::year(date),
    doy = lubridate::yday(date)
  ) |>
  dplyr::select(-date) |>
  dplyr::mutate(y = 1)

# Plot
ggplot(
  data = plot_data,
  mapping = aes(x = doy, y = factor(year), fill = n)
) +
  geom_col(colour = NA) +
  scale_fill_gradientn(
    colours = col_palette,
    na.value = na_col
  ) +
  coord_polar() +
  theme_void() +
  theme(
    legend.position = "none",
    plot.margin = margin(0, 0, 0, 0),
    plot.background = element_rect(fill = bg_col, colour = bg_col)
  )

Orcas, or killer whales, are highly intelligent marine mammals belonging to the dolphin family, known for their distinctive black-and-white markings. Southern Resident killer whales in the Pacific Northwest are critically endangered due to factors like pollution, food shortages, and habitat disturbance. Conservation efforts focus on protecting their food sources, reducing pollution, and minimising human impact on their environments.

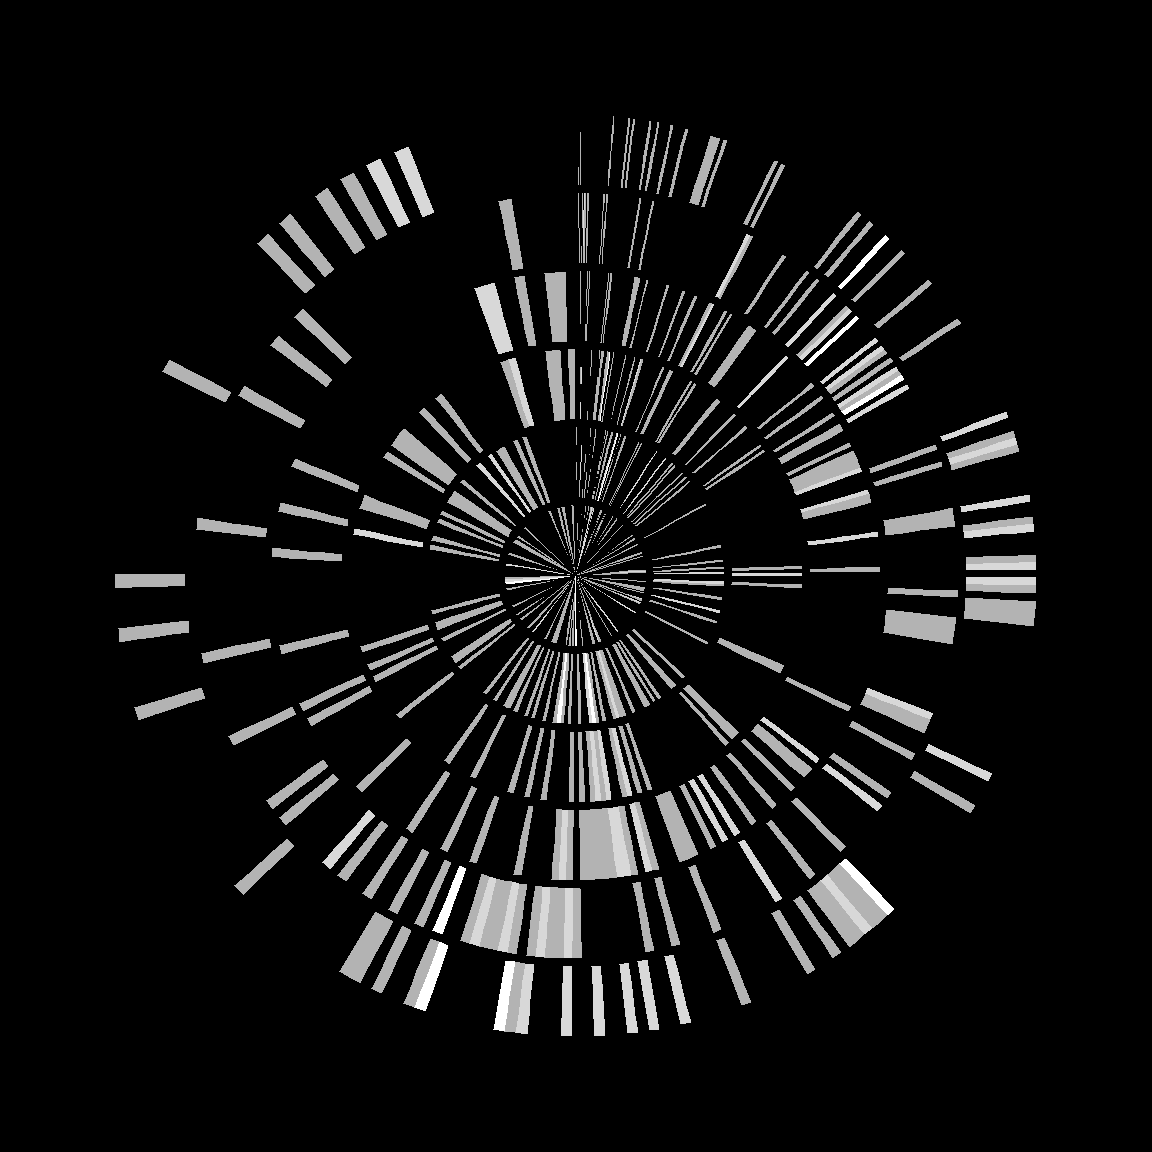
This visual showcases data from Center for Whale Research (CWR), the leading organization monitoring and studying Southern Resident killer whales in their critical habitat of the Pacific Northwest’s Salish Sea. It displays data on encounters (any time an orca is observed from one of CWR’s research boats or land, where at least one individual is identified and photographed) betwwen 2018 and 2023.

Each ring represents a different year, with 2018 at the centre and 2023 on the outside. Each line represents a day of the year, and the brightness of the line represents the number of encounters on that day. Brighter lines represent more encounters, and black areas represent days with no encounters.

Return to Data Art Gallery.