What's new in {PrettyCols} 1.0.1?
{PrettyCols} is an R package containing aesthetically pleasing colour palettes that are compatible with {ggplot2}. Find out about new features and palettes contained in the latest release!
February 3, 2023
Back in September 2022 I submitted {PrettyCols}, an R package containing aesthetically pleasing colour palettes, to CRAN. If you missed it, you can read the blog post introducing the package!
After a few months, it was time for an update and this blog post will give you a brief overview of some of the new features and palettes! You can install {PrettyCols} using:
| |
You can also install the development version from GitHub using:
| |
More palettes!
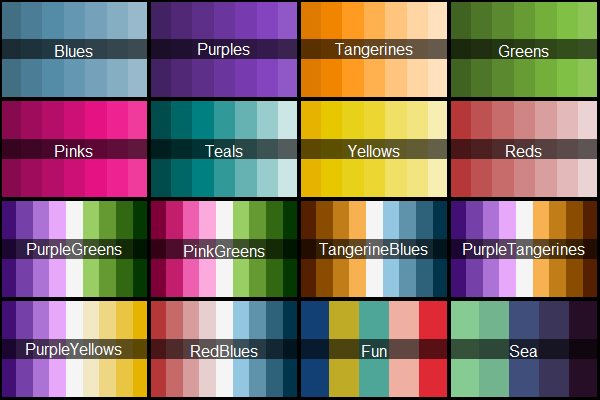
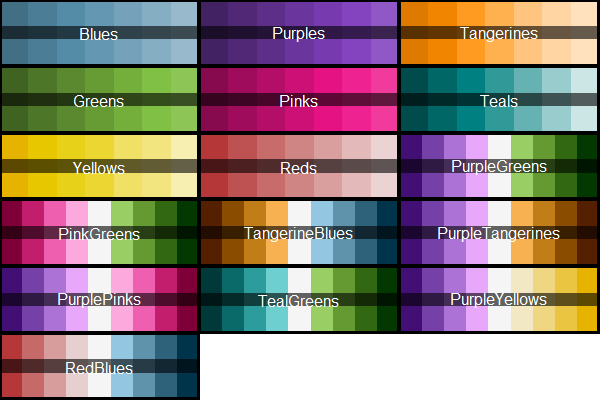
The new release contains twelve additional palettes, including two new sequential palettes (Yellows and Reds), two new diverging palettes (PurpleYellows and RedBlues), and eight new qualitative palettes. You can see the complete list of available palettes by running view_all_palettes():

or browsing the package vignette on available palettes.
Colourblind friendly palettes
| |

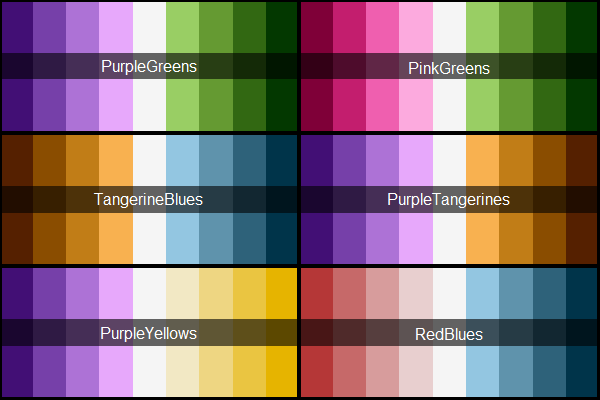
You can combine filtering by palette types with filtering by colourblind friendliness, for example to view only colourblind friendly diverging palettes:
| |

The view_all_palettes() function now also supports filtering by multiple types, e.g. to view all sequential and diverging palettes:
| |

The colourblind-friendliness has been checked using colorblindcheck::palette_check(), and a judgement made based on the number of distinct colour pairs with deuteranopia, protanopia, tritanopia in comparison to full colour vision. This judgement may not always be correct, and if you think a colour palette has been listed as colourblind friendly in error, please raise a
GitHub issue and I’ll re-classify the palette.
Python support
Edit: As of August 2023, Python support has moved to a separate package. See github.com/nrennie/PrettyPyCols.
This colour palette package was originally developed for use with R, particularly with {ggplot2}. However, many people make charts and generative art with Python instead. So, now you can use PrettyCols with Python. The Python code is adapted from the {MetBrewer} package from Blake Robert Mills which also provides support for R and Python.
You can install from GitHub and read more about how to use these palettes with Python in the Using with Python package vignette.
Here’s a small example of using the Bright colour palette with matplotlib to make a bar chart:
| |

To end this post, here’s another couple of examples of these palettes being used for generative art!


Show code
| |
There are plans for a few more updates in the future including even more palettes, and support for diverging colour scales in {ggplot2} which allows you to specify a midpoint for the scale. If you find that something in {PrettyCols} isn’t working, or if you’ve got an idea for more features, please raise a GitHub issue!
For attribution, please cite this work as:
What's new in {PrettyCols} 1.0.1?.
Nicola Rennie. February 3, 2023.
nrennie.rbind.io/blog/prettycols/whats-new-in-prettycols-101
BibLaTeX Citation
@online{rennie2023,
  author = {Nicola Rennie},
  title = {What's new in {PrettyCols} 1.0.1?},
  date = {2023-02-03},
  url = {https://nrennie.rbind.io/blog/prettycols/whats-new-in-prettycols-101}
}
Licence: creativecommons.org/licenses/by/4.0