Getting started with {gt} tables
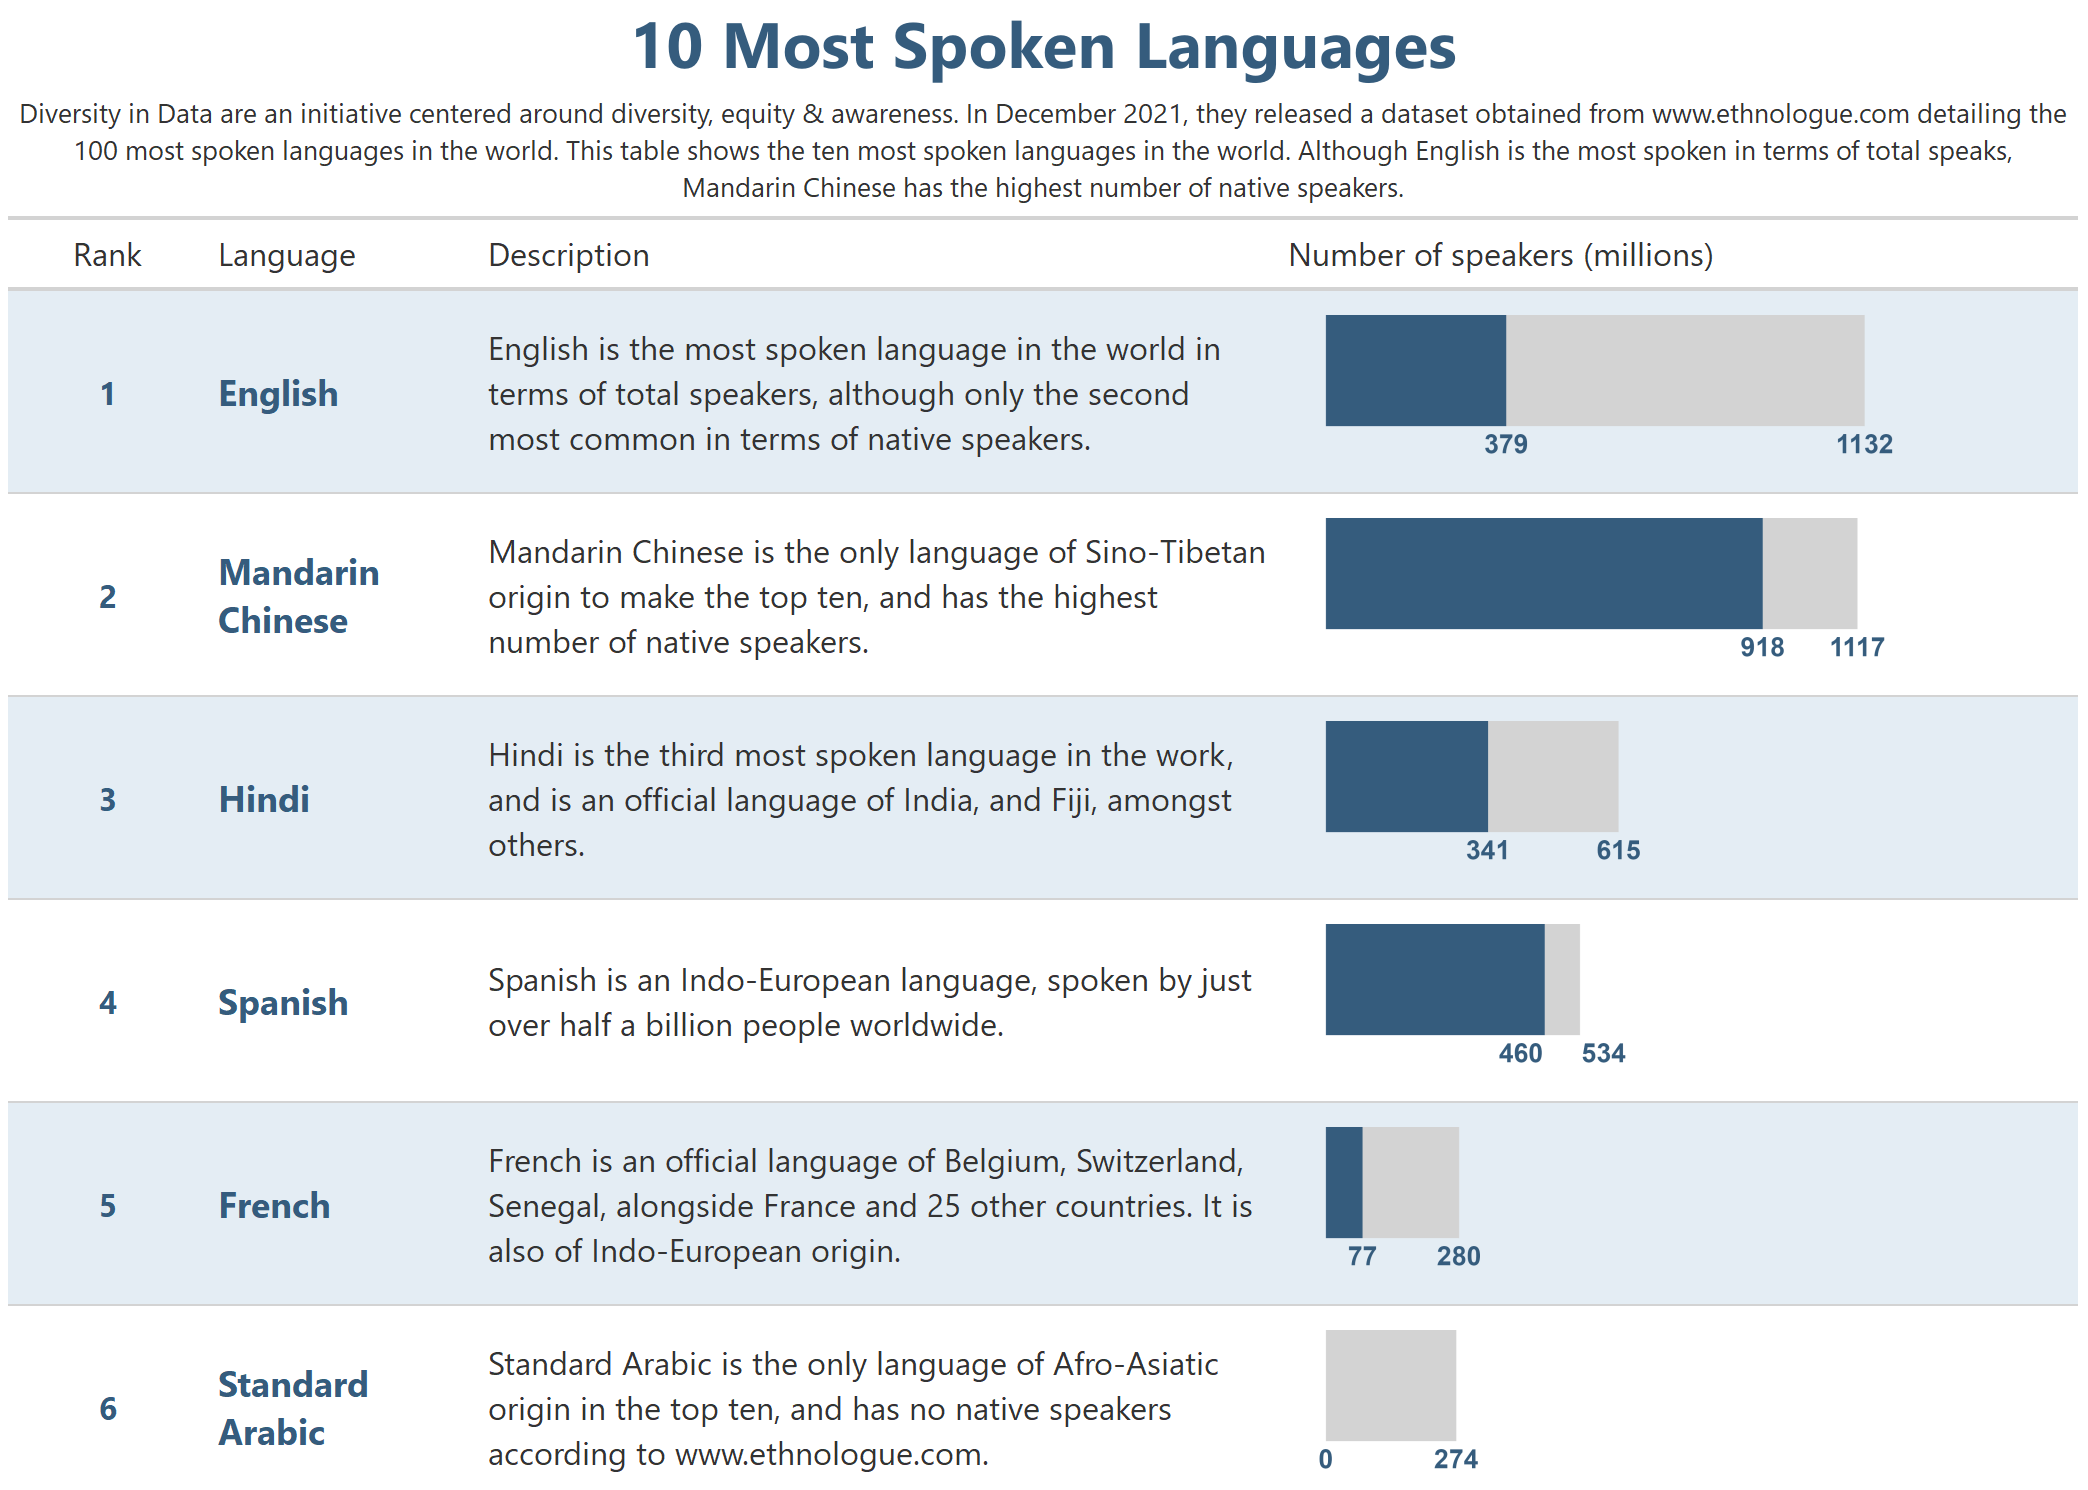
{gt} is an R package designed to make it easy to make good looking tables. This blog post demonstrates how to add plots as a column in a {gt} table.
A blog about all things visualisation, data science, and open source software. Some of these blog posts can also be found on R-bloggers, and many have been featured in the R Weekly highlights.
{gt} is an R package designed to make it easy to make good looking tables. This blog post demonstrates how to add plots as a column in a {gt} table.

Generative art is the process of creating artwork through a set of pre-determined rules often with an element of randomness. This blog post will outline the best practices I follow when creating generative art in R.
Last year I was a finalist in the 2021 Statistical Excellence Award for Early-Career Writing. This blog post introduces my article published in Significance and gives some tips for statistical writing.
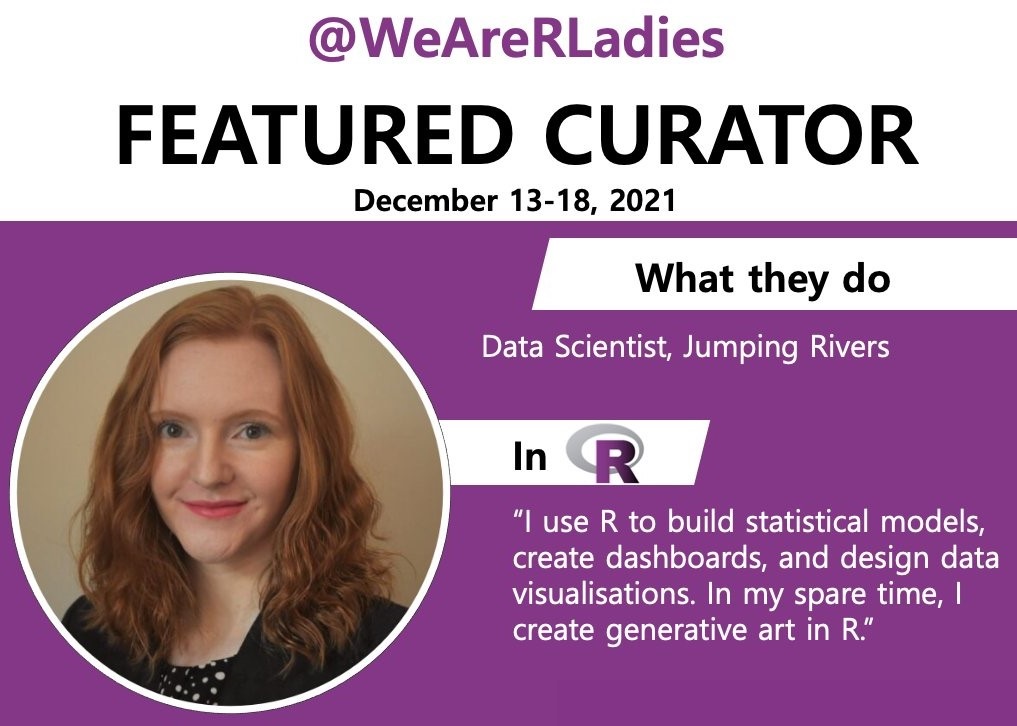
An overview of my experience of curating the @WeAreRLadies twitter feed.
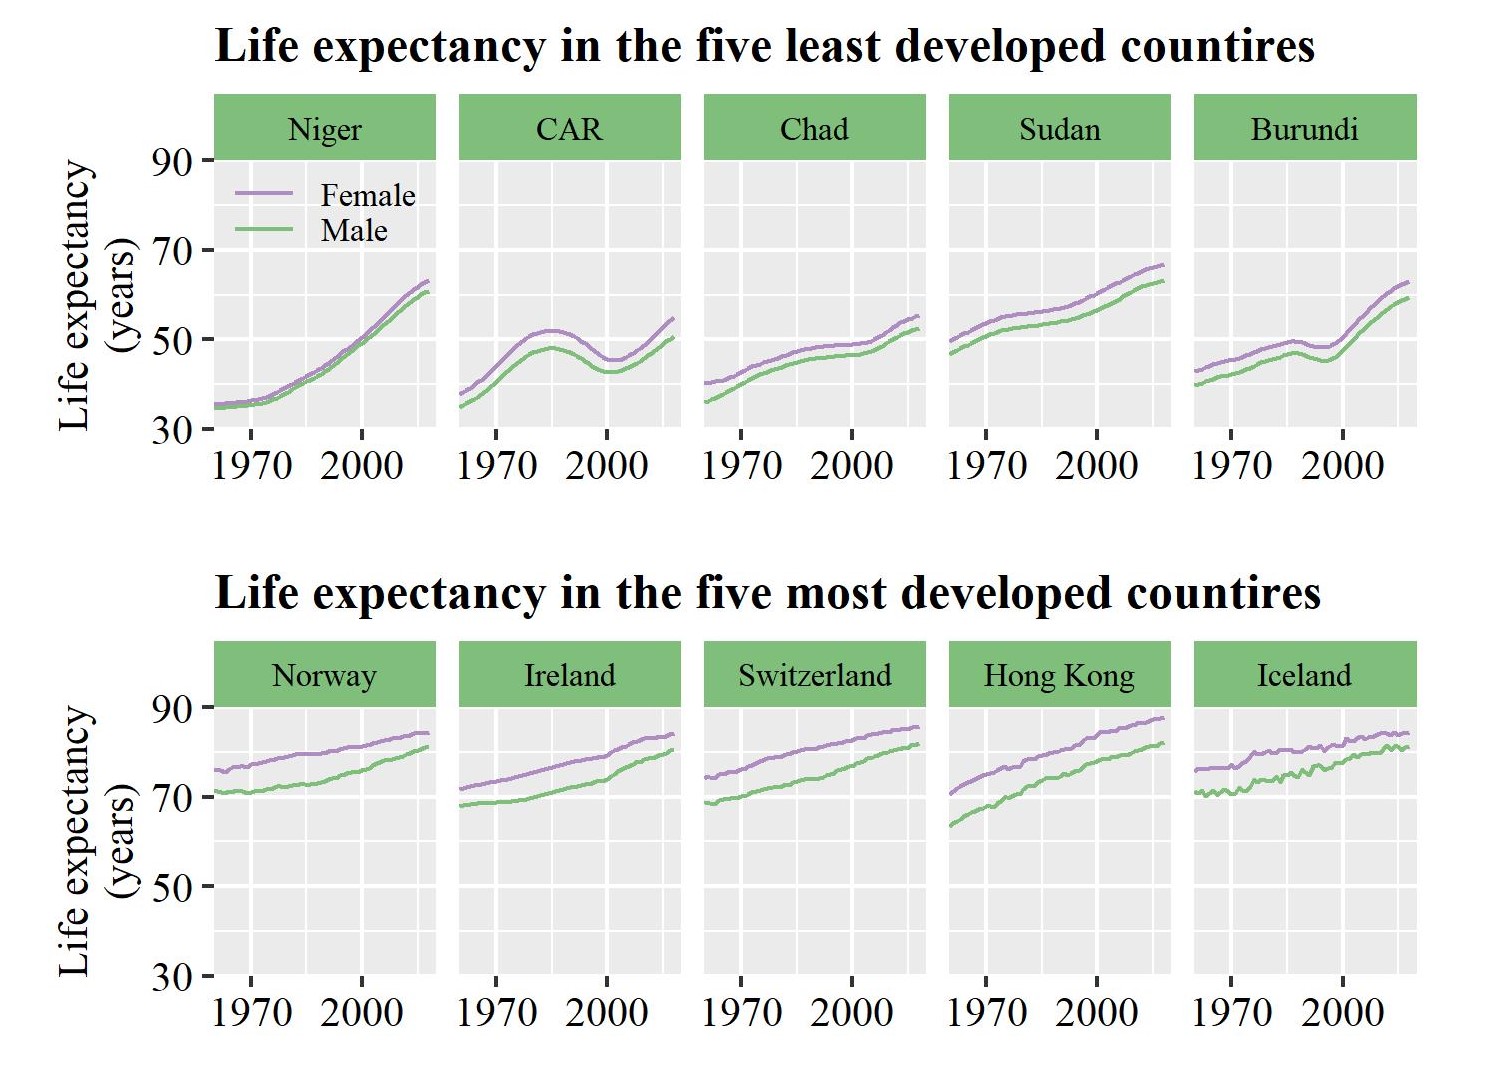
One of my goals for 2021 was to participate in the #TidyTuesday challenge on a regular basis. This blog post reflects on the past year of data visualisations.
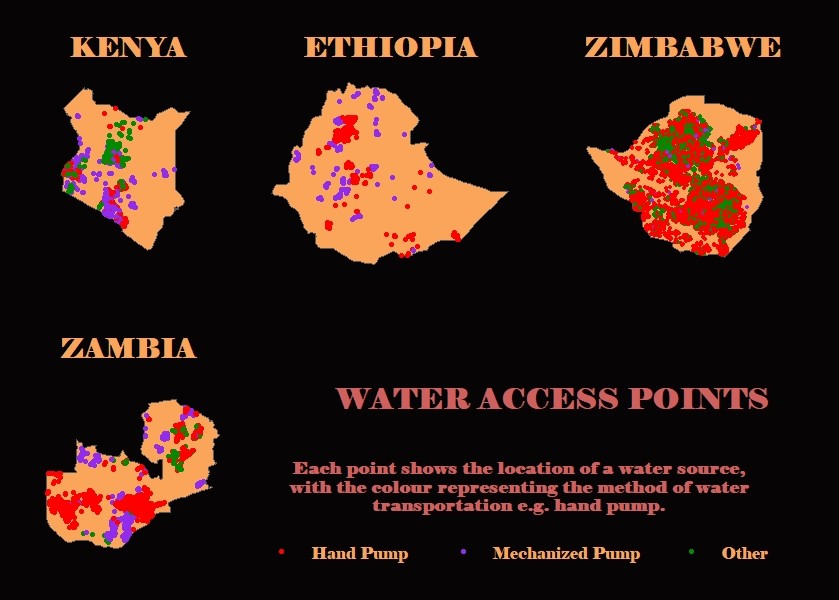
Earlier this week, whilst curating for @WeAreRLadies, I tweeted a thread on my thought process for this week’s #TidyTuesday challenge. This blog post expands on the thoughts in that thread.