
Introducing {PrettyCols}
Series: {PrettyCols}
An introduction to {PrettyCols} - a new R package containing aesthetically pleasing colour palettes that are compatible with {ggplot2}.
A blog about all things visualisation, data science, and open source software. Some of these blog posts can also be found on R-bloggers, and many have been featured in the R Weekly highlights.
An introduction to {PrettyCols} - a new R package containing aesthetically pleasing colour palettes that are compatible with {ggplot2}.
If, like me, you mostly scroll through Twitter on your phone, you might want to consider designing your content specifically aimed at people who look at Twitter on their phone. Here’s how to do it in R, with a little help from Quarto.
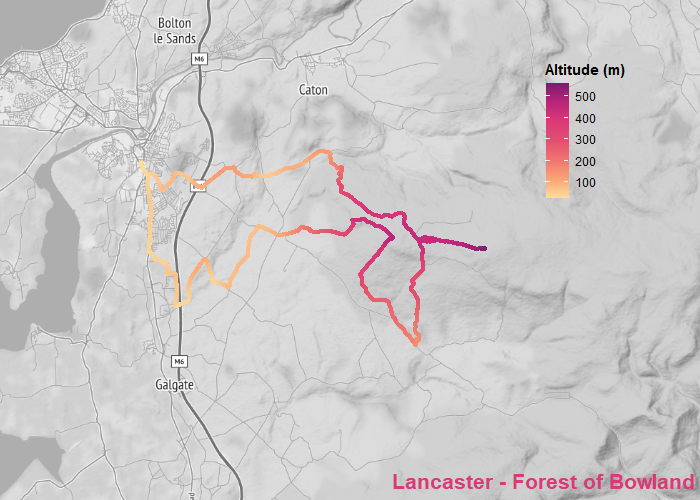
This tutorial blog will walk through the process of getting data from Strava using {rStrava}, making a map of it, and animating the map with {gganimate}.
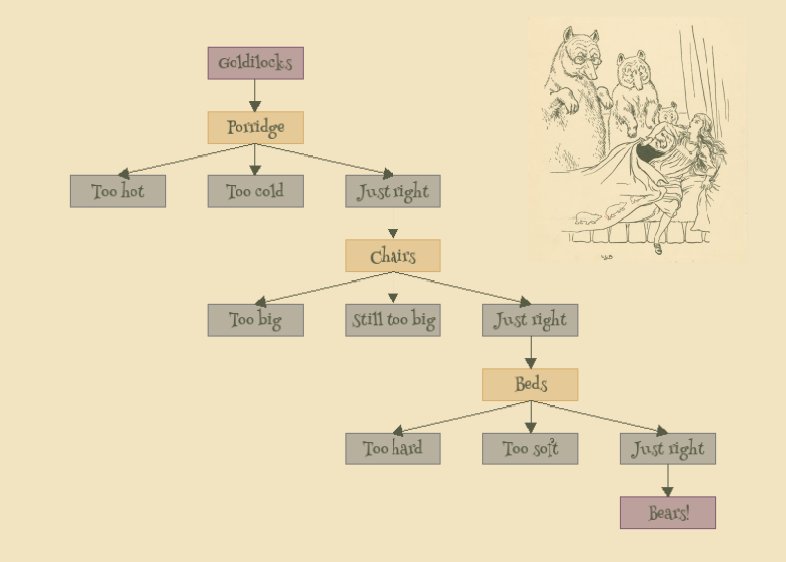
Flowcharts can be a useful way to visualise complex processes. This tutorial blog will explain how to create one using {igraph} and {ggplot2}.
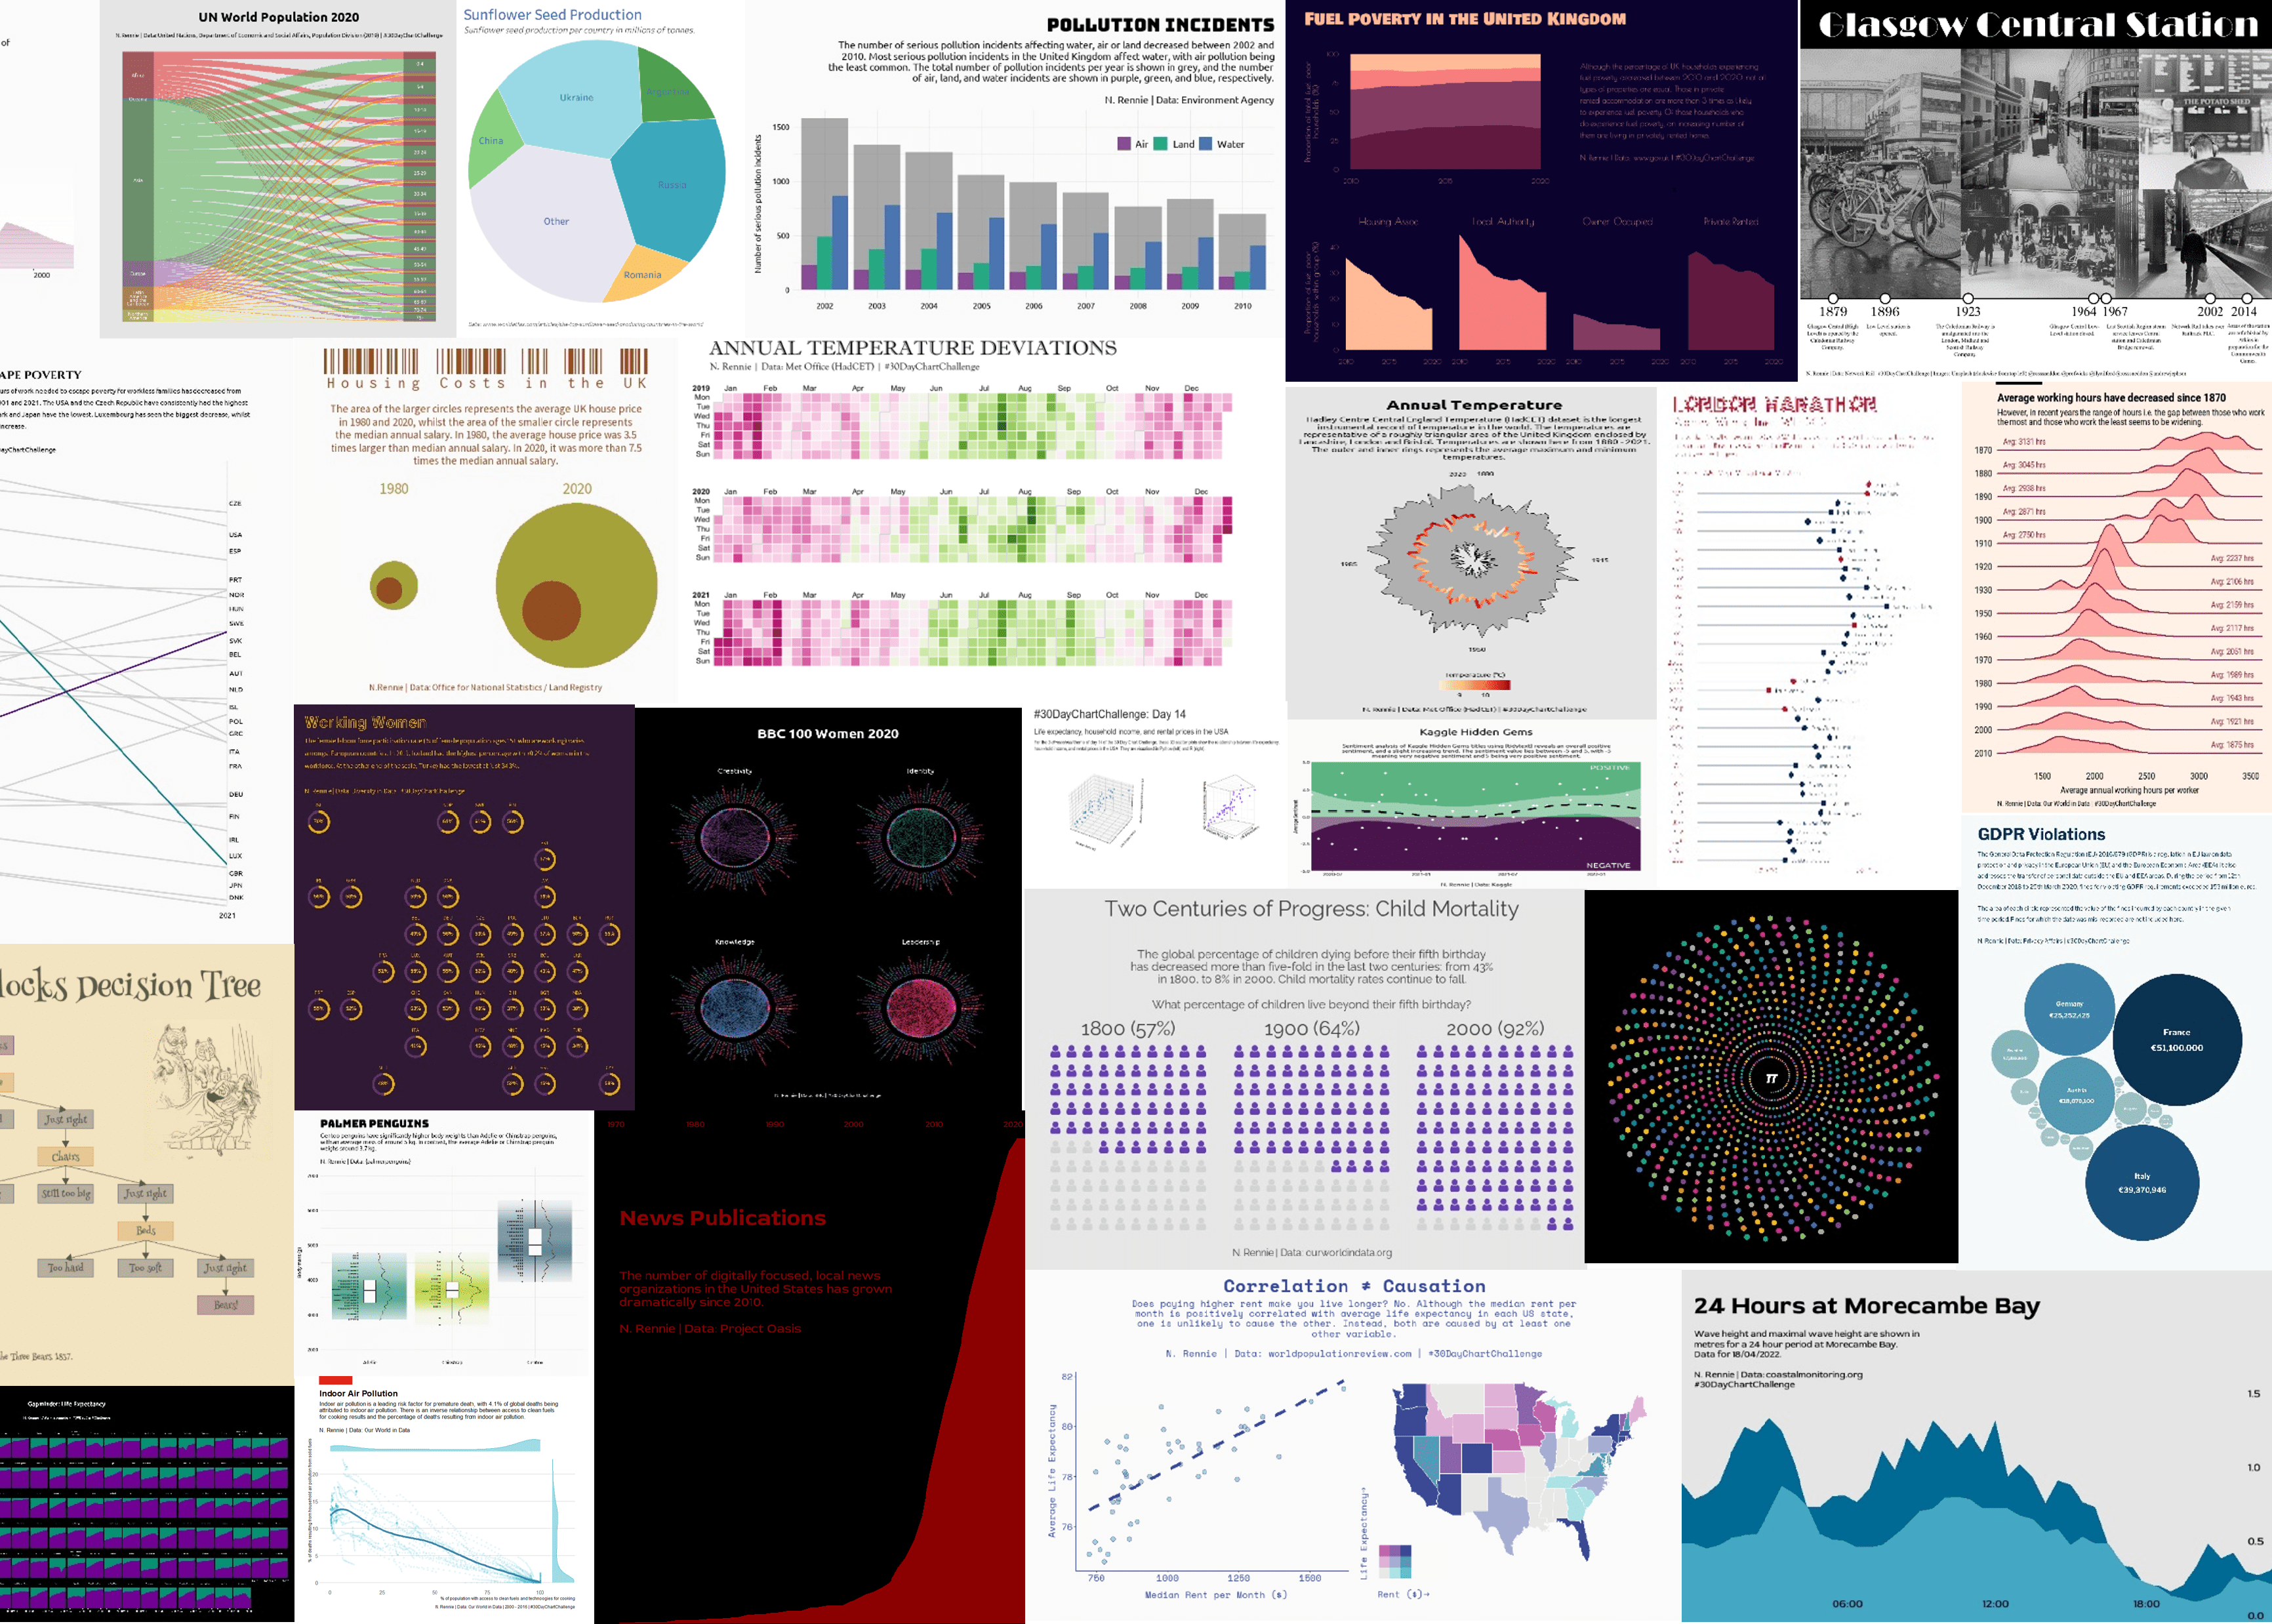
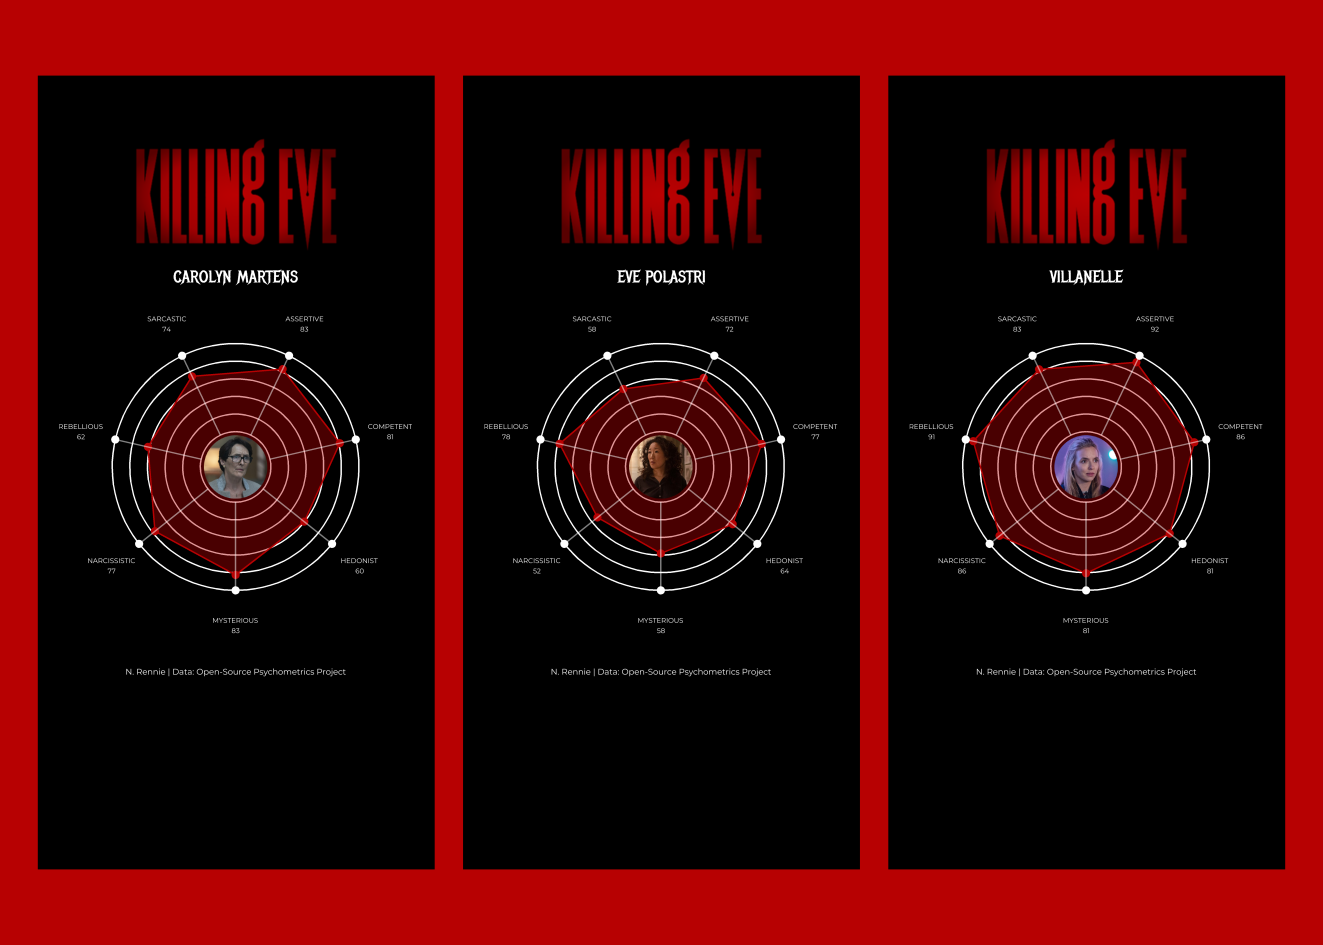
The #30DayChartChallenge is a data visualisation challenge where participants create a chart for each daily prompt.
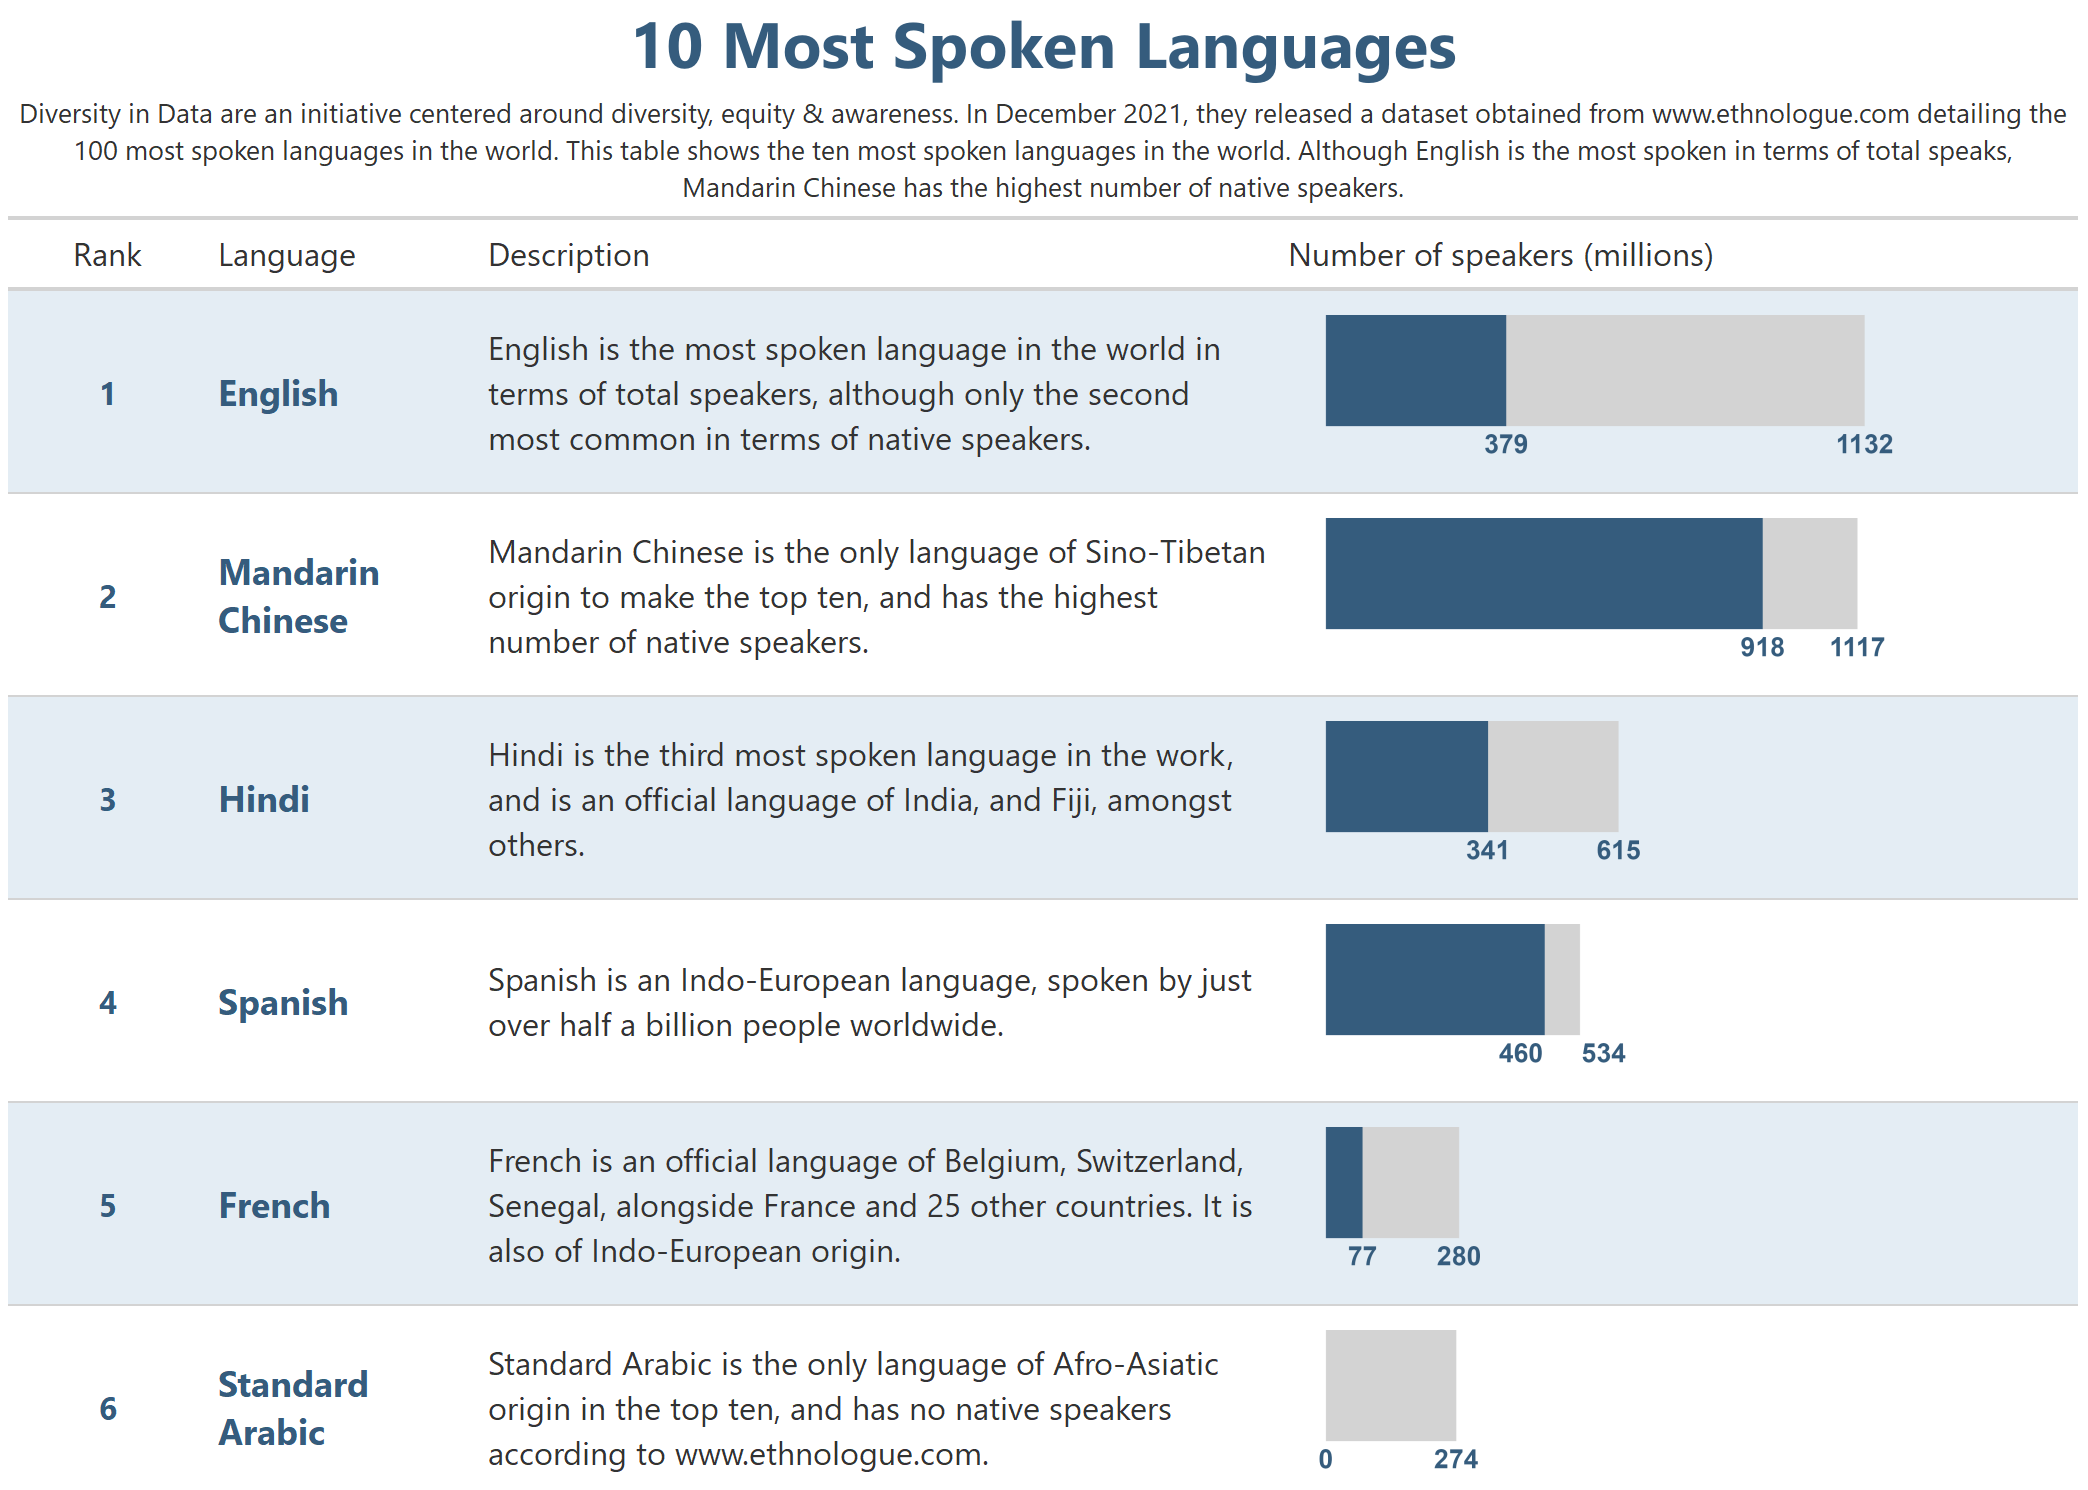
{gt} is an R package designed to make it easy to make good looking tables. This blog post demonstrates how to add plots as a column in a {gt} table.