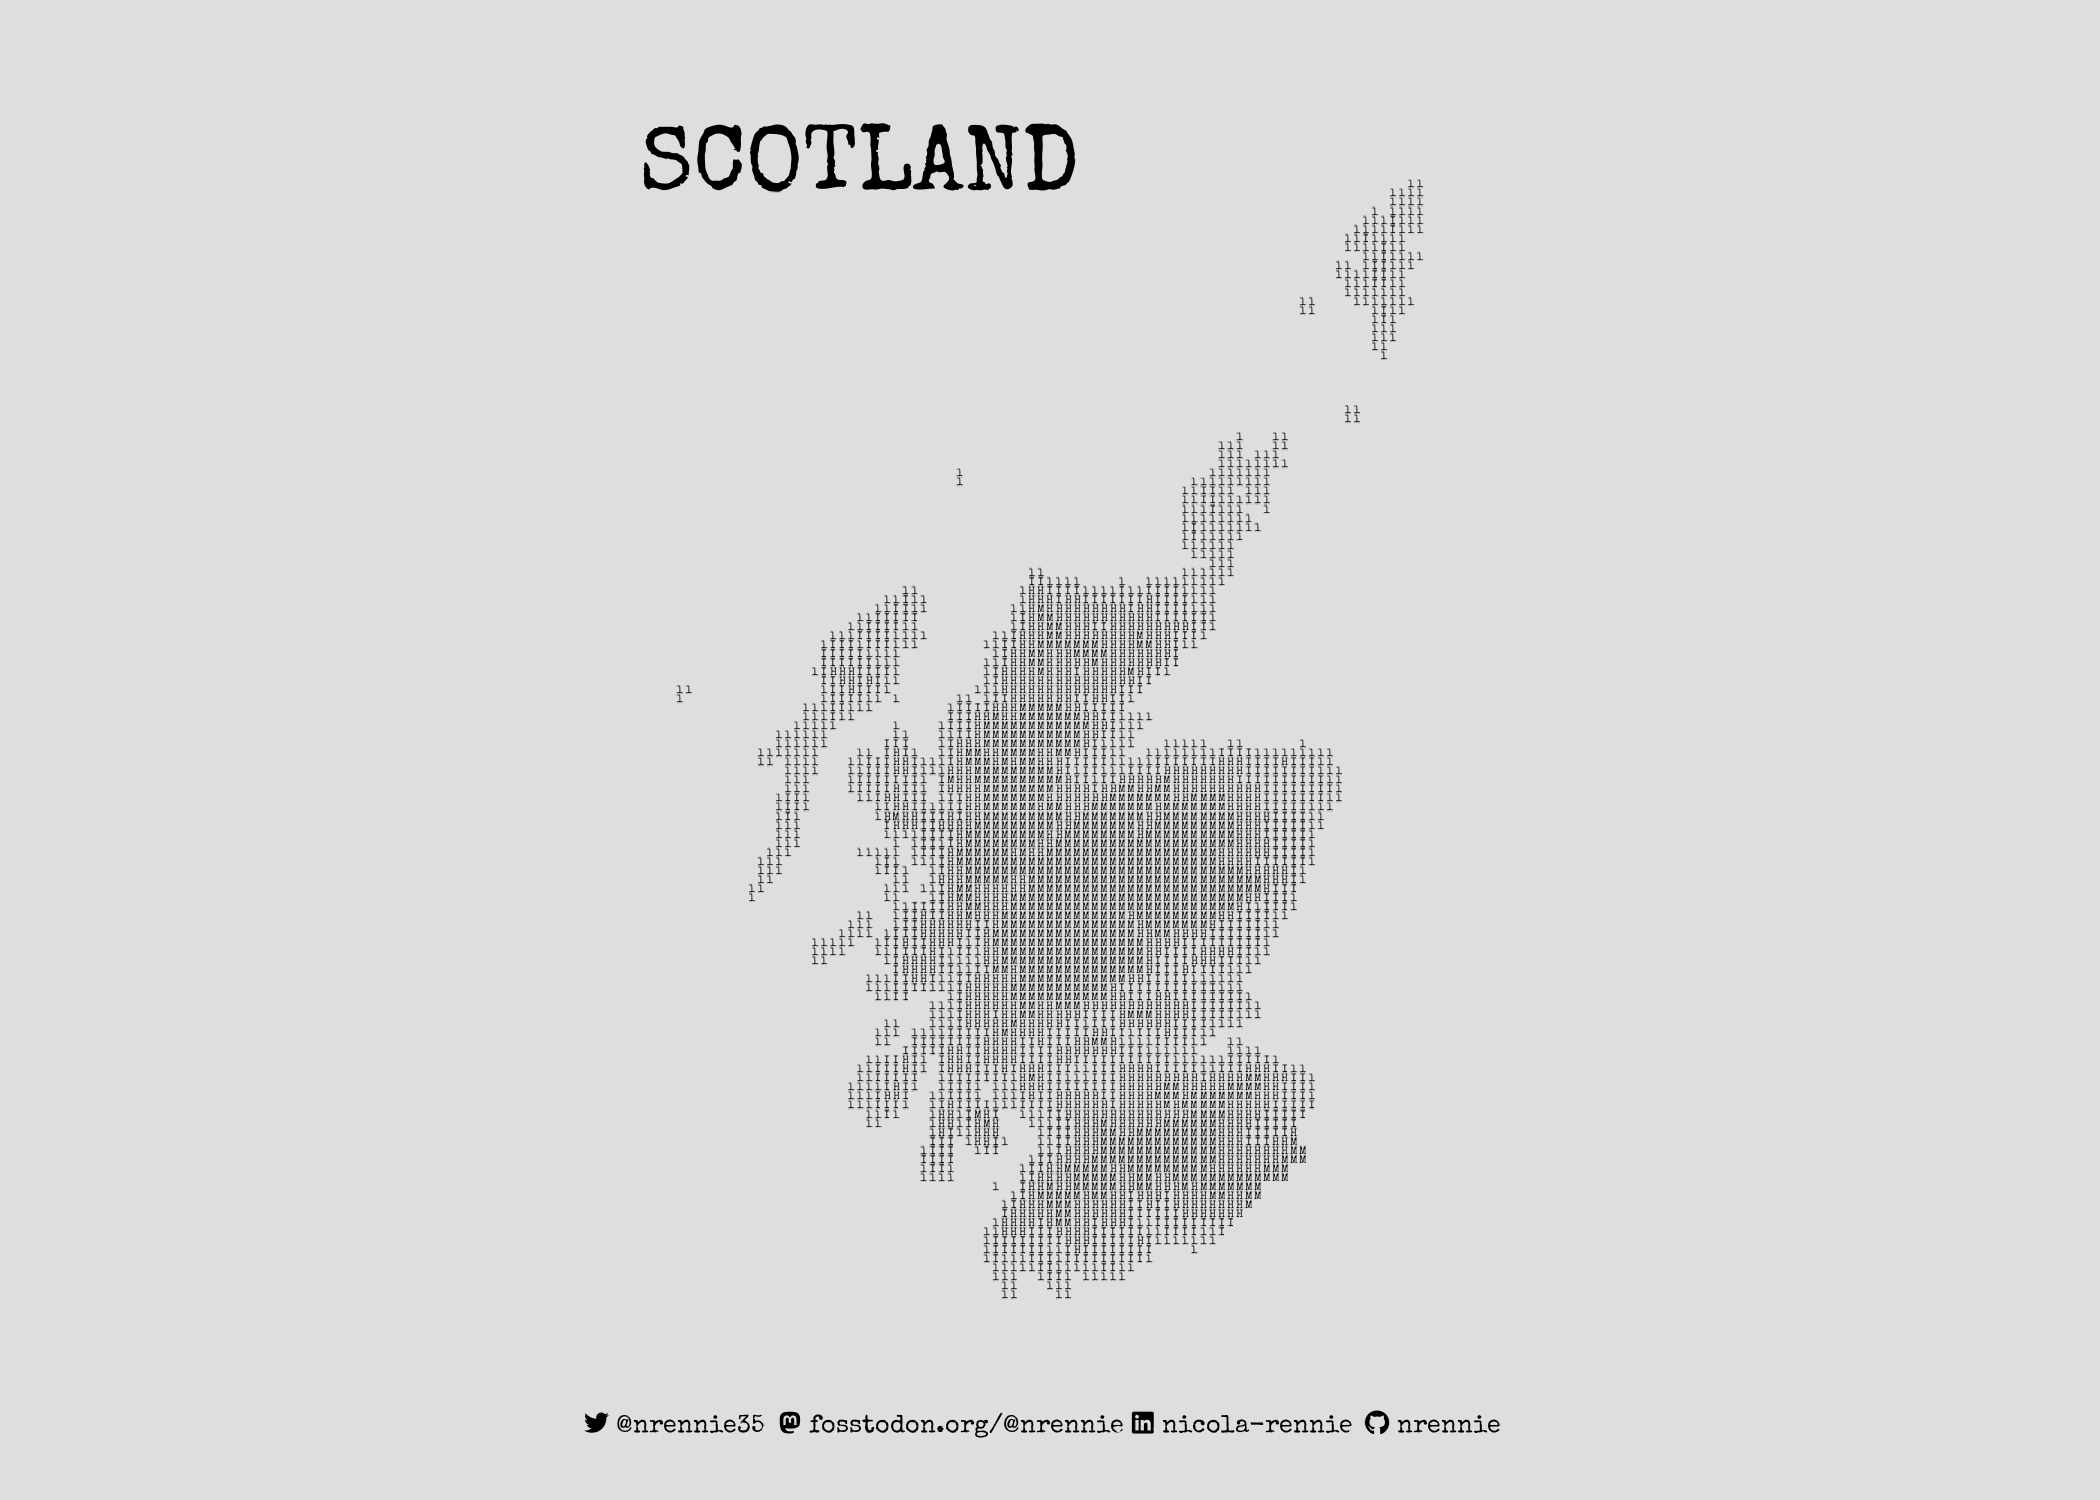
Creating a cracked egg plot using {ggplot2} in R
Inspired by a Visual Capitalist chart, this blog post will show you how to utilise spatial data R packages in a slightly unusual way to create an infographic in the shape of a cracked egg in R.
Blog about all things R, data science, and visualisation.
Inspired by a Visual Capitalist chart, this blog post will show you how to utilise spatial data R packages in a slightly unusual way to create an infographic in the shape of a cracked egg in R.
Time series analysis can uncover hidden structures in data collected over time. In this blog post, I’ll use {tsfeatures} to extract time series features and {tidymodels} to predict which sound recordings of heartbeats contain heart murmurs, using those time series features.
{rvest} is an R package within the {tidyverse} which helps you scrape data from web pages. This blog post will showcase an example of scraping data from Wikipedia on London Marathon races and winners.
Adding custom styling to documents makes them look more professional. This blog post will take you through the process of making a Quarto extension to create a reusable custom template for good-looking PDFs.
{PrettyCols} is an R package containing aesthetically pleasing colour palettes that are compatible with {ggplot2}. Find out about new features and palettes contained in the latest release!
Back in July 2022 at rstudio::conf(2022), Posit (formerly RStudio) announced the release of Shiny for Python. I wanted to see how the two compared - so I built the same Shiny app twice! This blog post highlights a few of the differences, and things that were a little tricky switching to Shiny for Python.