Introducing {PrettyCols}
An introduction to {PrettyCols} - a new R package containing aesthetically pleasing colour palettes that are compatible with {ggplot2}.
September 2, 2022
Making plots that are aesthetically pleasing has always been an important aspect of data visualisation to me. And when I later started creating generative art, I would spend time choosing colours purely based on whether they looked good together. On whether they made art that was pretty. Eventually, it became easier to convert those colours into a colour palette R package to avoid copying and pasting hex colours all the time. And so {PrettyCols} came to be. And yes, I did shorten it to Cols to avoid having to choose whether or not to put a u in colour…
Installing and using {PrettyCols}
{PrettyCols} is now on CRAN. Install it using:
| |
and load it into R using library(PrettyCols). You can also install the development version from
GitHub using:
| |
There are currently 20 palettes available in {PrettyCols}. You can view them all using the view_all_palettes() function.
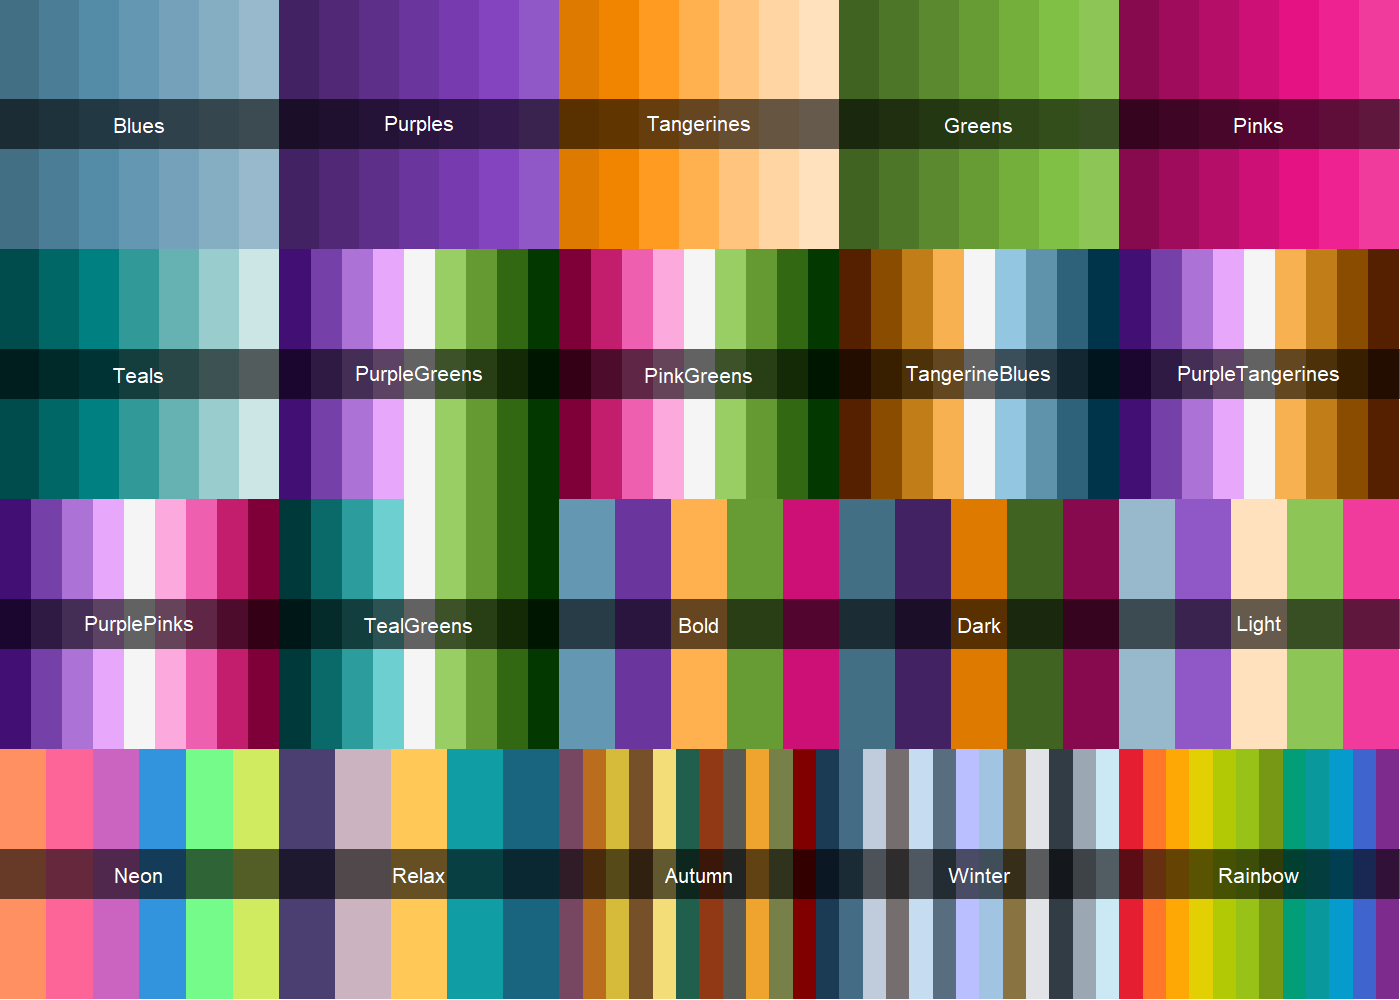
Each of the palettes falls into one of three categories: sequential (seq), diverging (div), or qualitative (qual). You can filter the palettes based on their type. For example, to see diverging palettes only:
| |

All palettes are also listed on the {pkgdown} website. Note that, since the primary use case of {PrettyCols} is generative art, not all of the palettes will work well for more traditional data visualisations. Not all palettes have high contrast between different colours, nor are they all colourblind friendly. However, further support for this will come with future releases.
An individual palette can be viewed or used through the prettycols() function. For example, to view the Relax palette, run prettycols("Relax"). The prettycols() function has four arguments:
name: the name of the colour palette desired. The names of all palettes can be found usingnames(PrettyColsPalettes).n: the number of desired colours. If the number of requested colors is larger than the number of colours in the palette, colours are automatically interpolated. Ifnis not provided, all colours in the palette is used.type: whether the palette should be"discrete"or"continuous". The default is"discrete".direction: either1or-1, whether the palettes should be used in left-to-right order, or right-to-left.
The package vignettes give examples of changing the values of these arguments.
Does {PrettyCols} work with {ggplot2}?
Yes! {PrettyCols} has four key functions that mean you can use the palettes to customise your plots made with {ggplot2}.
scale_fill_pretty_d()scale_colour_pretty_d()(orscale_color_pretty_d())scale_fill_pretty_c()scale_colour_pretty_c()(orscale_color_pretty_c())
These four functions mean that you can use the palettes for either discrete or continuous variables, mapped to either the fill or colour aesthetics. If you want some more details on how you can use {PrettyCols} with your {ggplot2} plots, read the
Using with {ggplot2} vignette.
What’s coming next?
{PrettyCols} is currently a work in progress, and there are already a few things on my list to add into the next release! Upcoming features will include:
- More palettes!
- The ability to filter and view only colourblind friendly palettes.
- The ability to view multiple types of palette at the same time e.g. return all sequential and diverging palettes.
- Support for changing legend titles in the colour or fill scales.
These features are currently listed as issues on GitHub, and I will slowly work my way through them. If you have other suggestions for new features, or if you find a bug, please create an issue in the GitHub repository.
Some generative art examples
Since the motivation behind this colour palette package was for using in generative art, it seems only fair to include a few examples of generative art that uses {PrettyCols}! All of the examples here can be reproduced using my {aRt} package, which can be found on GitHub.
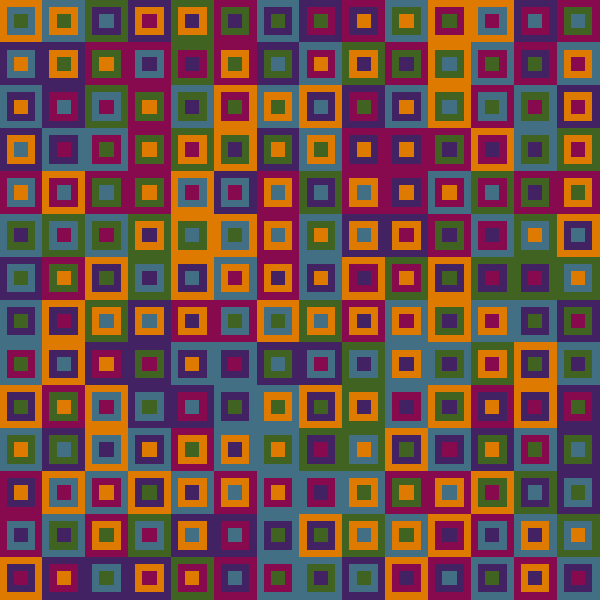
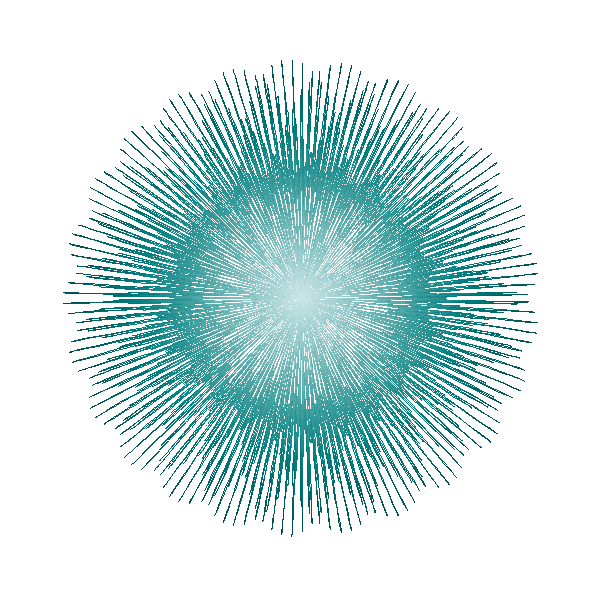
Show code
| |


Show code
| |
The most important part…
Of course, the most important part of any R package is the hex sticker! You might recognise the background as being one of the generative art pieces created above.
![]()
For attribution, please cite this work as:
Introducing {PrettyCols}.
Nicola Rennie. September 2, 2022.
nrennie.rbind.io/blog/introducing-prettycols
Licence: creativecommons.org/licenses/by/4.0