sysfonts::font_add(
  family = "Font Awesome 6 Brands",
  regular = "path-to-font/Font-Awesome-6-Brands-Regular-400.otf"
)
showtext::showtext_auto()Adding social media icons to charts with {ggplot2}
R
Data Visualisation
TidyTuesday
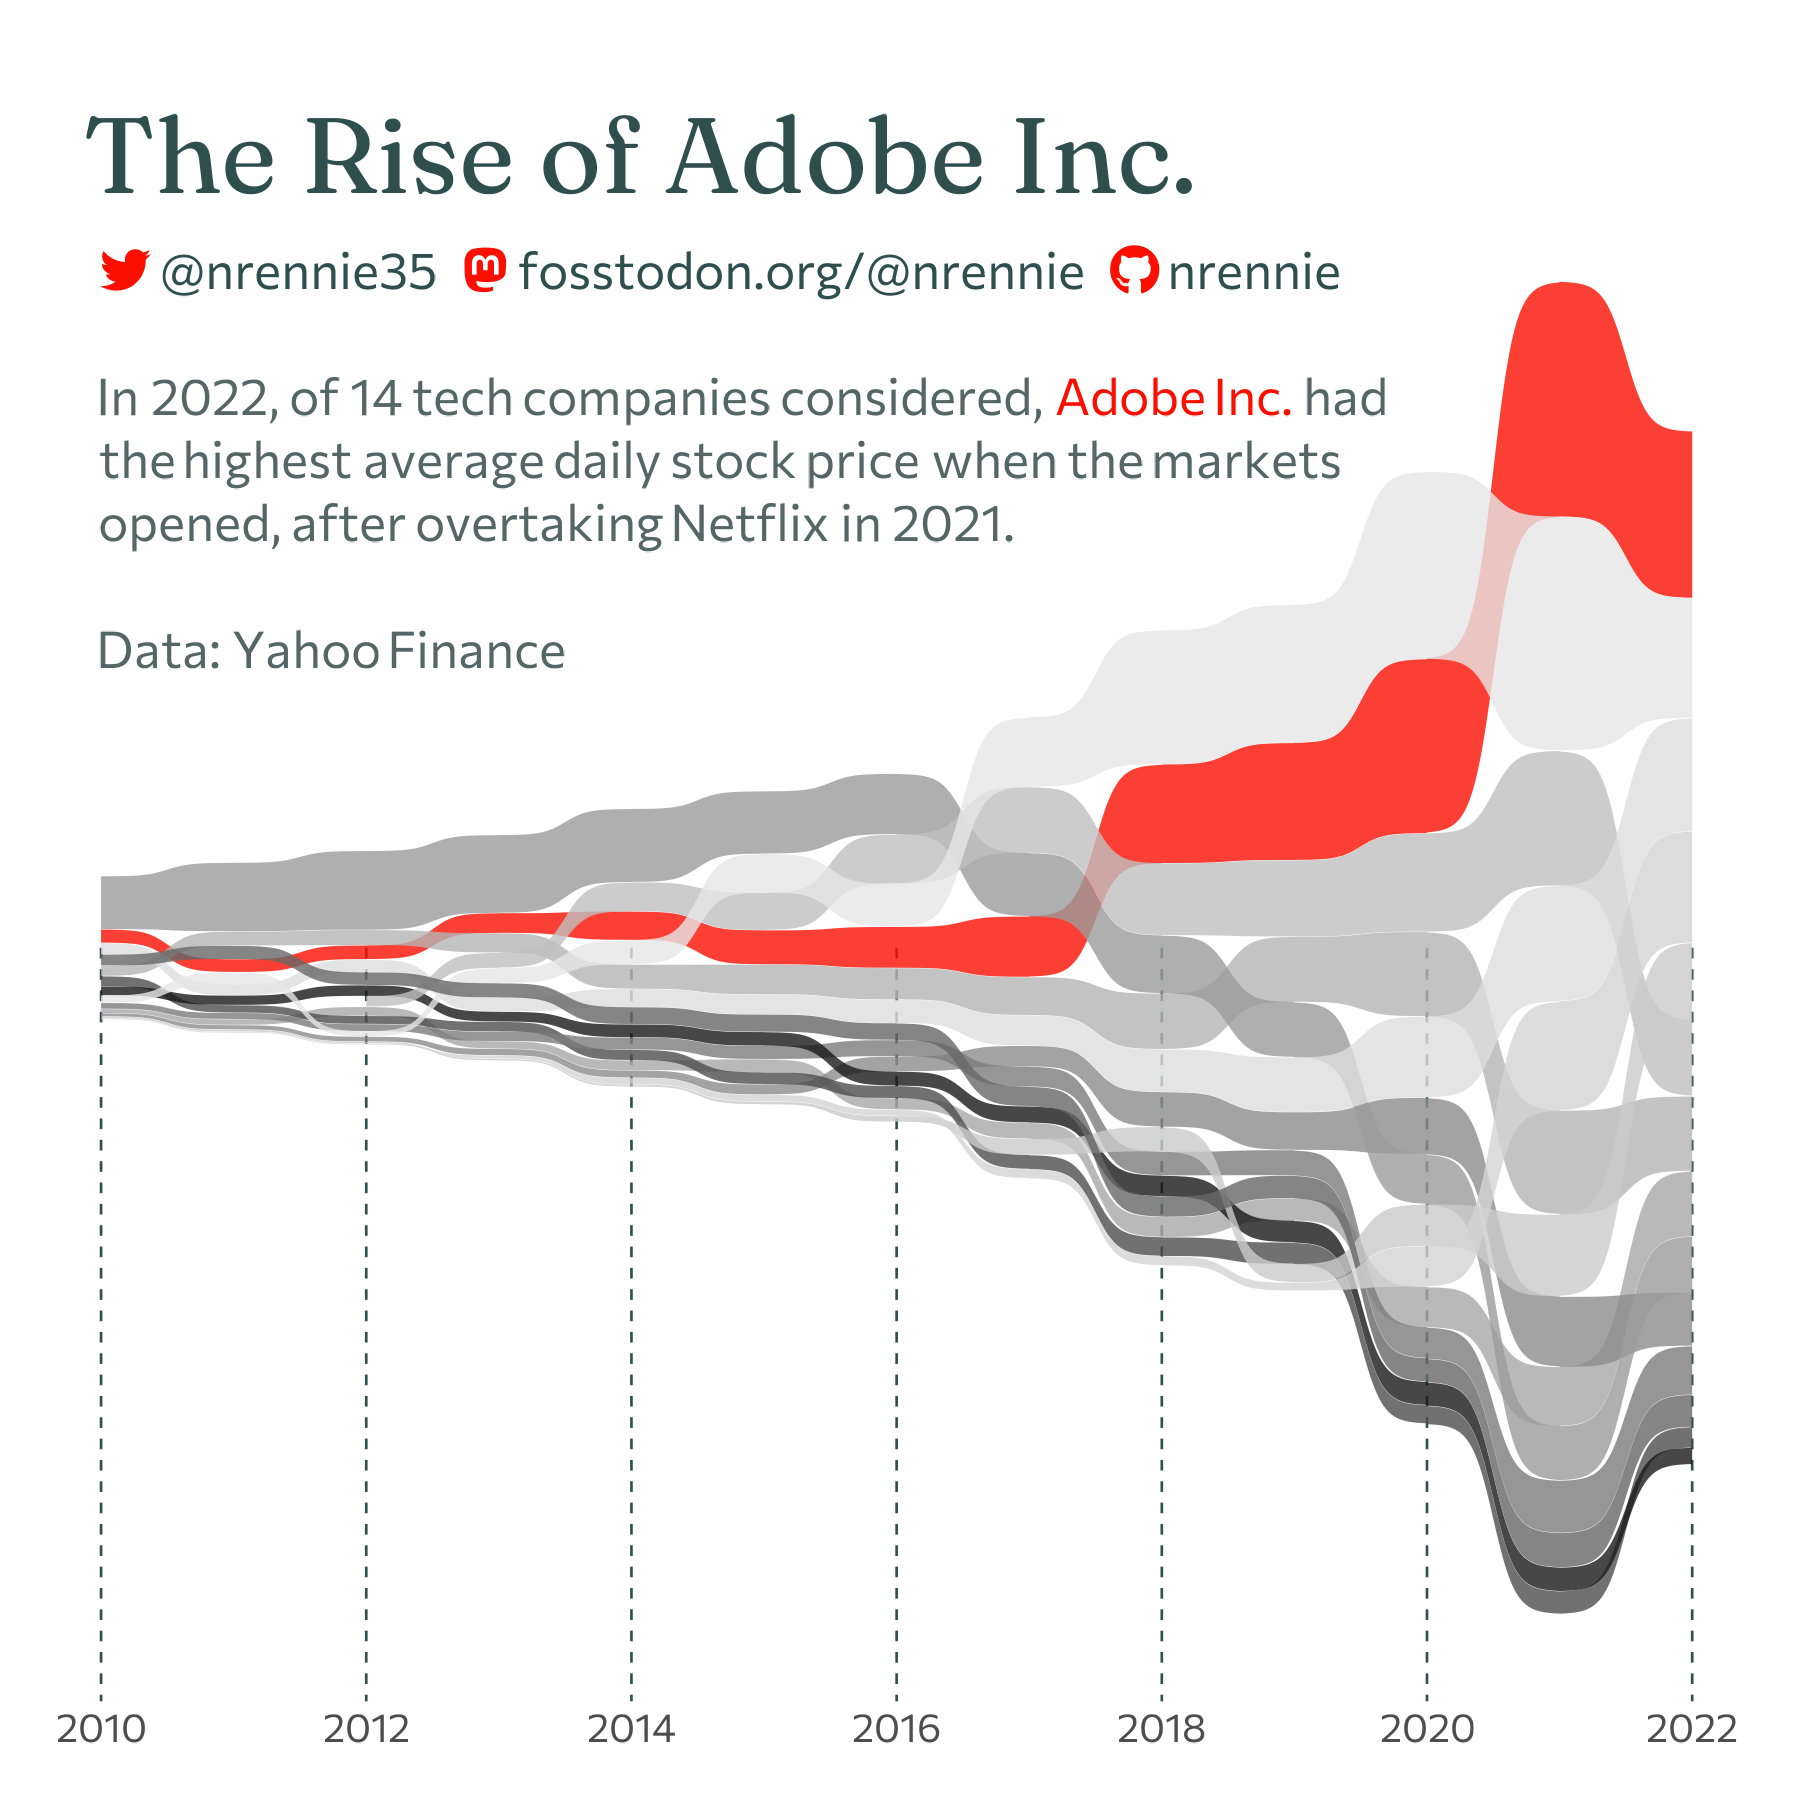
Adding social media icons to your data visualisation is a great, concise way to put your name on your work, and make it easy for people to find your profile from your work. This blog post explains how to add social media icons to {ggplot2} charts.
When I’ve created data visualisations with {ggplot2} recently, I’ve been adding icons with my social media details in the caption. It’s a great, concise way to put your name on your work, and make it easy for people to find your profile if they see your work elsewhere. Tanya Shapiro was the first person I saw doing this in R - so full credit to her for the inspiration!
Installing Font Awesome icons
The first part of adding icons to {ggplot2} that we’ll deal with is getting the icons themselves. To get social media icons such as those for LinkedIn or Mastodon, we’ll use Font Awesome icons. There are a couple of options for working with Font Awesome in R - including the {fontawesome} and {emojifont} packages. Here, I’ve opted for a more direct approach - download the font file and then load the font into R.
You can download the font file from the Font Awesome website at fontawesome.com/download. Font Awesome has multiple icon families available for download. For adding social media icons, we’re specifically interested in the Font Awesome Brands family. If you want to add other icons to your plots, feel free to download multiple font families and install them in the same way.
We can load the fonts into R using the {sysfonts} and {showtext} packages:
Note: If you are using
ggsave()with the default resolution of 300 dpi, you may also wish to runshowtext_opts(dpi = 300).
Using icons in {ggplot2} text
Let’s say we want to add a GitHub icon to our {ggplot2} chart caption. We first need to know the unicode for the GitHub icon. You can search for the icon you want at fontawesome.com/icons, and you’ll see the unicode icon in the top right of the screen. Although a Google search or ChatGPT would likely work equally well…
![]()
The unicode for the GitHub icon is f09b, and to use this in HTML code we can write it as . Let’s save that as a variable so we don’t have to remember it, and also save the GitHub username we want to display next to the icon as another variable.
github_icon <- ""
github_username <- "nrennie"Now we need to combine our icon and username into something that {ggplot2} can understand, and we’ll do that by writing some HTML code. We can wrap the icons (and text) inside some <span> tags. This lets us specify which font we want to use to display the icon - Font Awesome. You don’t need to wrap the GitHub username inside <span> tags as well, but you can if you want to change elements like font family, colour or size as I’ve done below.
We can use glue() (or paste0()) to reference the variables we created with the GitHub icon and username, and include them in the HTML code:
social_caption <- glue::glue(
  "<span style='font-family:\"Font Awesome 6 Brands\";'>{github_icon};</span>
  <span style='color: #E30B5C'>{github_username}</span>"
  )
And then we can pass that HTML code into the caption (or title, subtitle etc.) of our chart via the labs() function:
library(ggplot2)
ggplot() +
  labs(caption = social_caption)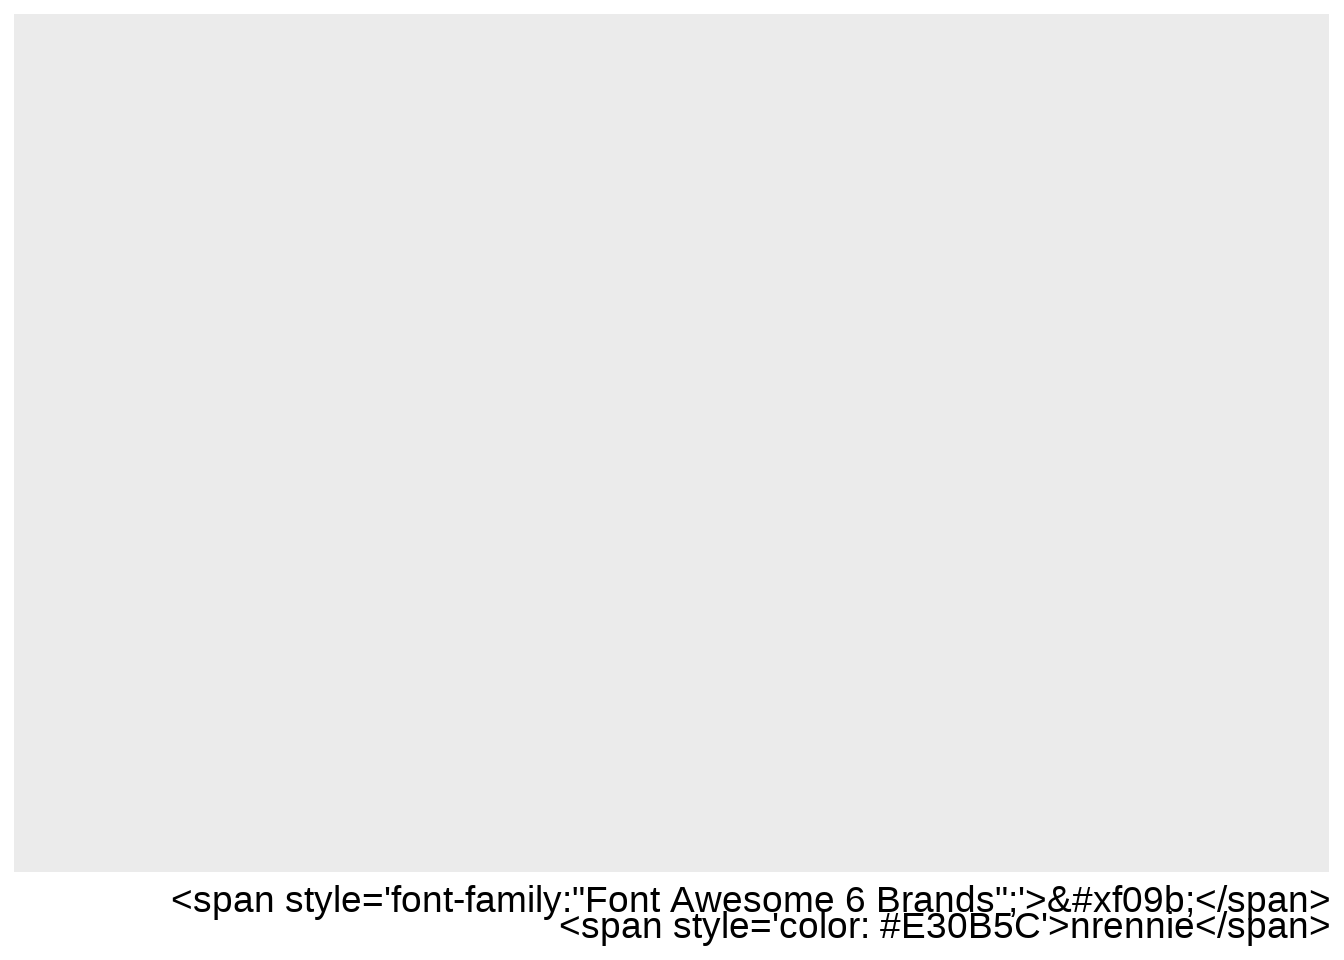
Hmm… that’s not quite done exactly what we want. We need one more thing - a little bit of help from {ggtext}!
Formatting with {ggtext}
The reason our previous plot didn’t look quite as we’d hoped is because {ggplot2} doesn’t natively understand how to parse the HTML code. That where {ggtext} comes in. {ggtext} is an R package designed to improve text rendering in {ggplot2}, including providing support for using Markdown and HTML inside text elements. It’s one of my favourite {ggplot2} extension packages, and often use it for adding coloured text to the subtitle as a substitute legend.
We can specify within the theme() that the caption element should interpret the string we’ve provided as HTML or Markdown text by using element_textbox_simple():
library(ggtext)
ggplot() +
  labs(caption = social_caption) +
  theme(plot.caption = element_textbox_simple())
If you’ve added icons to the title or subtitle instead, you’d want to update the relevant theme() argument instead. You could also use element_textbox() which works very similarly but has slightly different default values or element_markdown(), if you’d prefer.
And that’s how you add social media icons to plots with {ggplot2} (and {ggtext})! You can include additional styling such as using a different font for the username text, or changing the size or colour of the icons by including more options inside the <span> tags. You can also edit the basic font properties using the arguments in element_textbox_simple().
If you think adding social media icons is something you’d do regularly, I’d recommend wrapping this code up into your own function. You can save the icon unicode values you’ll need so you don’t have to look them up, pass your social media usernames as arguments, and add optional arguments that control the icon colour, for example. If you want to take it one step further, you could write an R package that stores the Font Awesome font files, and makes use of .onLoad() to automatically load the icon fonts when you call library(pkgname).
Additional resources
The {ggtext} package vignettes include some more information on using HTML and Markdown in {ggplot2} text elements if you’re less familiar with these: wilkelab.org/ggtext/articles/theme_elements
Albert Rapp has an excellent blog post on using fonts and icons with {ggplot2}: albert-rapp.de/posts/ggplot2-tips/08_fonts_and_icons

Reuse
Citation
BibTeX citation:
@online{rennie2023,
  author = {Rennie, Nicola},
  title = {Adding Social Media Icons to Charts with \{Ggplot2\}},
  date = {2023-07-27},
  url = {https://nrennie.rbind.io/blog/adding-social-media-icons-ggplot2/},
  langid = {en}
}
For attribution, please cite this work as:
Rennie, Nicola. 2023. “Adding Social Media Icons to Charts with
{Ggplot2}.” July 27. https://nrennie.rbind.io/blog/adding-social-media-icons-ggplot2/.